View analytics common to orgs, groups and portfolios

Exposure management over time

In the Fluid Attacks platform, you can track the evolution of your systems from a security point of view:
- Open vulnerabilities represent a risk currently impacting your end-users and systems.
- Open vulnerabilities with accepted treatment are exactly like open ones, except that you decided to coexist with that risk.
- Closed vulnerabilities may be seen as security breaches that your system no longer has.

- CVSSF Exposure Level. (The graph that displays by default)
- Vulnerability level, where it tells you the total vulnerabilities.
- The data of the last 30, 90 days, or all.
Sprint exposure increment
This figure is the percentage increase in risk exposure in the current sprint (i.e., the newly reported exposure value relative to the initial exposure value). The value is zero when no vulnerability has been reported in the period.
Sprint exposure decrement
This figure is the percentage decrease in risk exposure in the current sprint (i.e., the newly remediated exposure value relative to the initial exposure value). The value is zero when no vulnerability has been remediated in the period.
Sprint exposure change overall

This figure is the resulting percentage change in risk exposure in the current sprint (i.e., the exposure decrement minus the exposure increment). A positive value means that more exposure was reported than remediated. A negative value means that more exposure was remediated than reported. A zero value means that as much exposure was remediated as reported.
Exposure management over time (%)

This section shows the percentage of closed, accepted and open vulnerabilities over time, based on our standard CVSSF and total vulnerabilities.
Exposure benchmark

In this chart, you will be able to compare your risk exposure levels (CVSSF) results with other organizations, groups or portfolios (the best, the average, and the worst).
 Note: To establish benchmark criteria when comparing organizations to identify, among others, the best or worst in terms of exposure, it has been decided to use a reference point that excludes organizations with low activity. In this case, the organizations included in this graph have experienced over 100 reattacks on vulnerabilities within their groups. This approach allows us to maintain fairness in our comparisons and ensure that the results reflect the performance of the organizations.
Exposure trends by vulnerability category

According to the nine categories that group the different types of vulnerabilities, it will be possible to filter by 30, 60, 90 and 180 days how the CVSSF of these has varied, showing whether the exposure has increased or decreased.
Note: This graph uses a logarithmic scale, showing numerical data over a wide range of values, allowing us to show exponential differences more adequately in small graphs.Days since last remediation
Days since a finding was effectively closed.
Mean time to request reattacks
This metric shows the average number of days it takes customers to request a reattack.

Vulnerabilities being re-attacked
This metric shows an integer, which refers to the vulnerabilities still in the reattacked state, waiting for validation by Fluid Attacks.
Days until zero exposure

This is an estimate of the total number of days it will take you to remediate all the vulnerabilities reported to this date.
Mean time to remediate (MTTR) benchmark
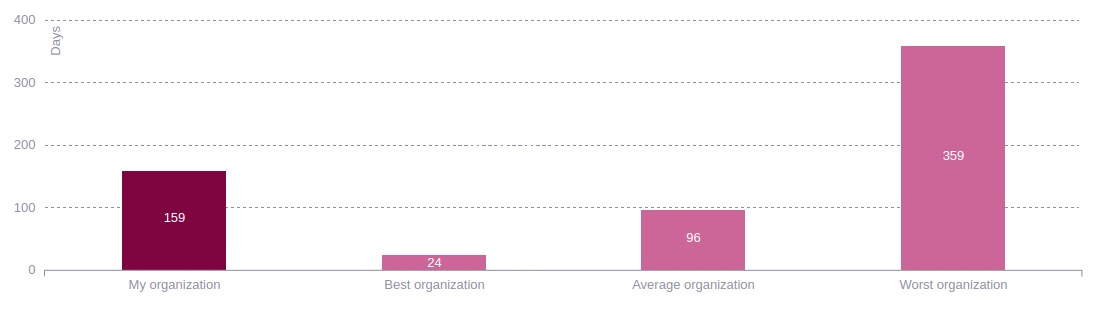
This section shows the average time your organization, group, or portfolio takes to fix vulnerabilities. These times are weighted by exposure to risk (CVSSF) and days with non-treated, which refers to non permanently accepted treatment vulnerabilities. Also you can filter by the data of the last 30, 90 days, or all. You can compare your numbers to those of the best, the average, and the worst organizations.
Mean time to remediate (MTTR) by CVSS severity

Here you can see the average number of days it takes to remediate vulnerabilities grouped by the CVSS severity in your organization, group, or portfolio. These times are weighted by exposure to risk (CVSSF).
- Days per exposure (The graph that displays by default)
- Days are counted without applying CVSSF
- Non-treated CVSSF which refers to non permanently accepted treatment vulnerabilities.
- Non-treated days are counted without applying CVSSF which refers to vulnerabilities whose treatment is not permanently accepted.
- The data of the last 30, 90 days, or all.
Accepted vulnerabilities by CVSS severity

Here you can see information about the vulnerabilities that you have accepted against those that are open and if those vulnerabilities have low, medium, high or critical severity.
Vulnerabilities by assignment
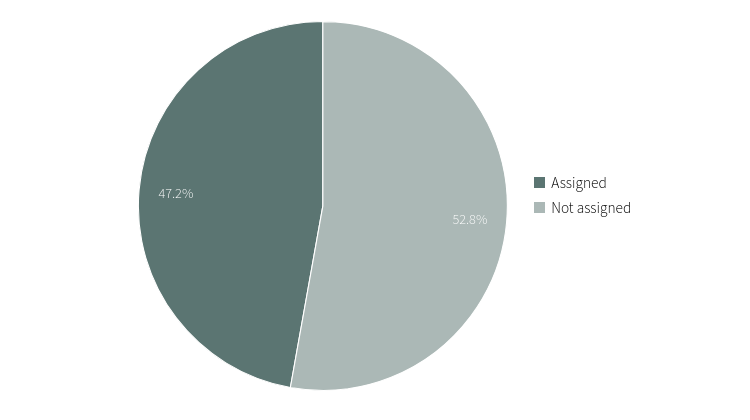
This pie chart in an organization, group or portfolio shows you the percentage of open vulnerabilities assigned to your team members versus the percentage of those vulnerabilities not yet assigned.
Status of assigned vulnerabilities
Of all the vulnerabilities already assigned, it is shown what percentage are Open or Closed.

Exposure by type

- Exposure severity level the our CVSSF metric.
- Number of Vulnerabilities.
- According to what type Code, infra and app.
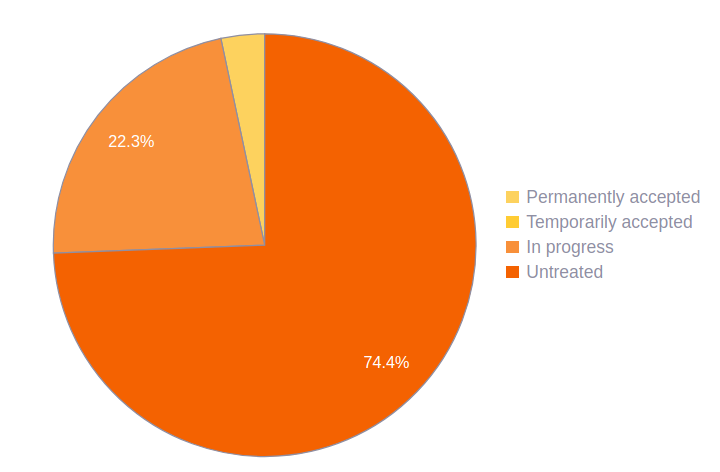
Vulnerabilities treatment
On Fluid Attacks' platform, you can plan and manage the remediation of security findings. Vulnerabilities can be grouped according to their assigned Treatment:
-
Untreated: New vulnerabilities go here until you generate an action plan and assign it to a developer.
-
In progress: With this treatment, you acknowledge the existence of the vulnerability and assign a user to it in order to ensure it is solved.
-
Temporarily accepted: This treatment is used when you don't intend to solve the vulnerability, but only temporarily, in which case you accept the risks that come with it until a selected date.
-
Permanently accepted: As with the previous treatment, this is used when you don't intend to solve the vulnerability, but this time you accept the risks that come with it permanently.
Report technique

Of all the vulnerabilities reported (Open and Closed), what is the percentage of these according to the different types of security tests (SAST, DAST, SCA, SCR, RE, CSPM and Manual penetration testing MPT).
Active resources distribution
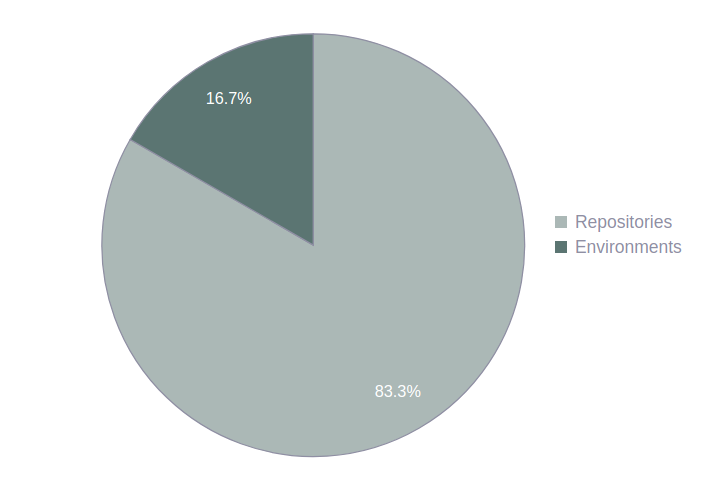
Resources can be of two types: Environment and Repository.
- Environment: A URL or IP pointing to an instance of your system.
- Repository: The associated source-code of the environment and (ideally) its infrastructure.
The maximum benefit is reached when every environment has its full source-code available for us to test it.
Total types
A type is a group of vulnerabilities on your system related to the same attack vector.

Total vulnerabilities

Vulnerabilities are the minimum units of risk. They are tied to a system, and a specific location within that system.
Total exclusions
Exclusions are vulnerabilities deliberately omitted by you. The total number of exclusions your group has is shown.
Exclusions by root
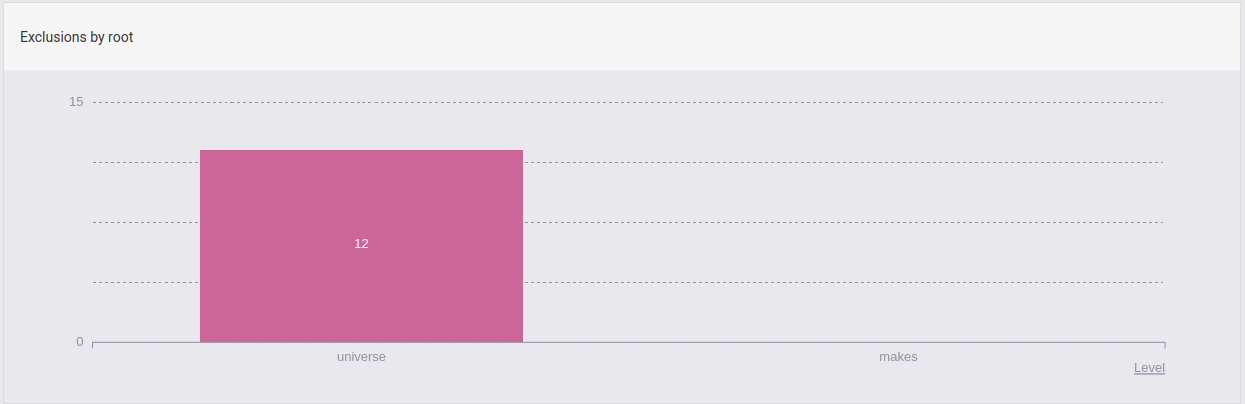
These are all your exclusions categorized by root.
Vulnerabilities by tag

These are all your vulnerabilities categorized by tag. Tags can be assigned at the moment of defining a treatment for your vulnerabilities, for more information click here.
Vulnerabilities by level

These are all your vulnerabilities categorized by level. Levels can also be assigned at the moment of defining a treatment for your vulnerabilities, for more information click here.
Accepted vulnerabilities by user

These are the accepted vulnerabilities grouped under the user with access to them that accepted the vulnerabilities.
Exposure by assignee

This bar chart in an organization, group or portfolio has two modes of presentation, which can be accessed using the filter function. It shows you each of your team members with the percentages corresponding to the different treatments they have given to (a) the total vulnerabilities or (b) the total risk exposure CVSSF assigned to them.
Files with open vulnerabilities in the last 20 weeks
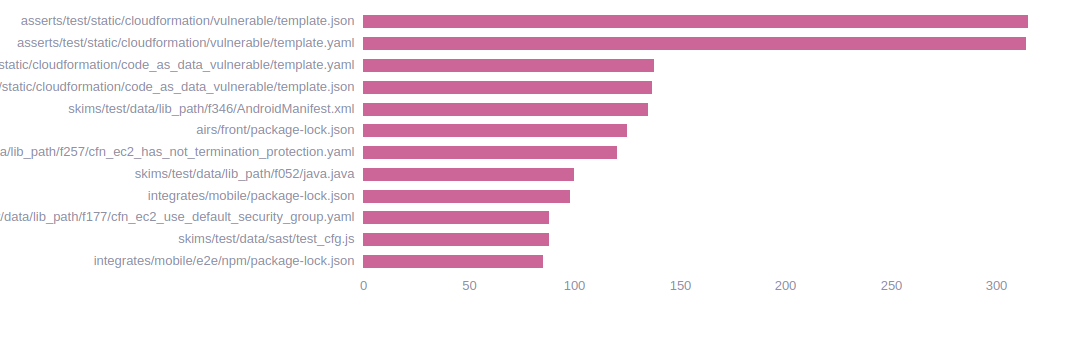
From the last 20 weeks, you can see the files are reported with open vulnerabilities and the total number of these. The X-axis represents the total number of vulnerabilities and on the Y-axis you can see the name of the registered files.