Resolve Events impeding tests
Sometimes, a situation may arise in a group that prevents Fluid Attacks' tool or analysts from testing part of the scope or maybe all of it. Your team needs to keep track of these situations and solve them, so Fluid Attacks can resume the assessments. The place on the platform where you can see a cumulative record of those situations, including those solved and unsolved, in your groups is its Events section.
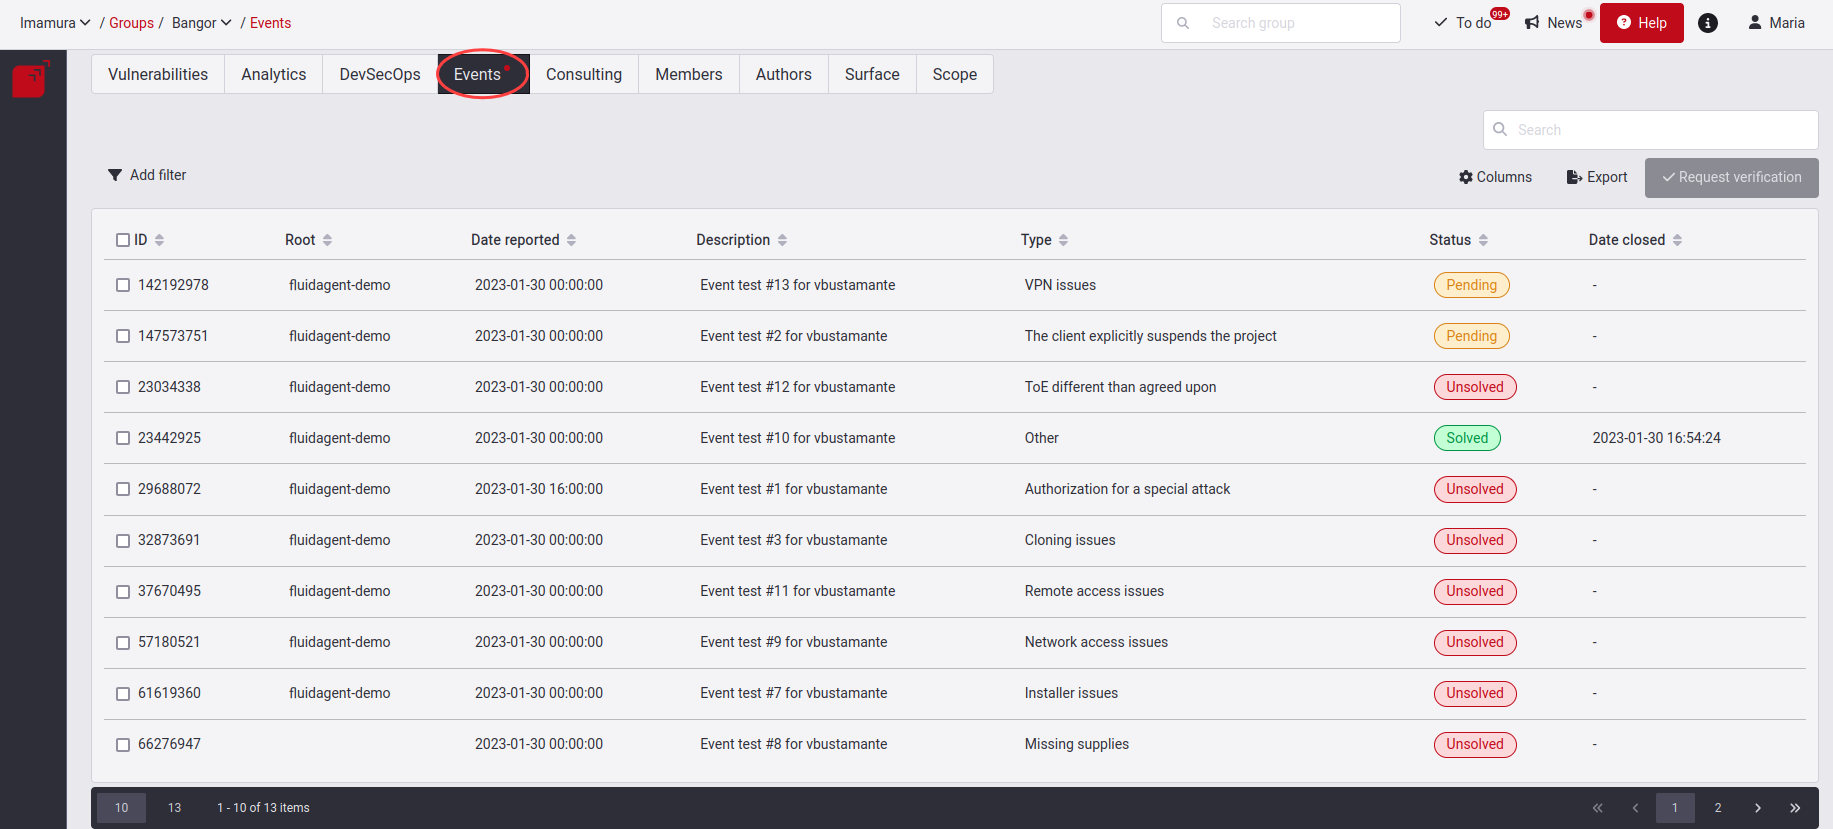
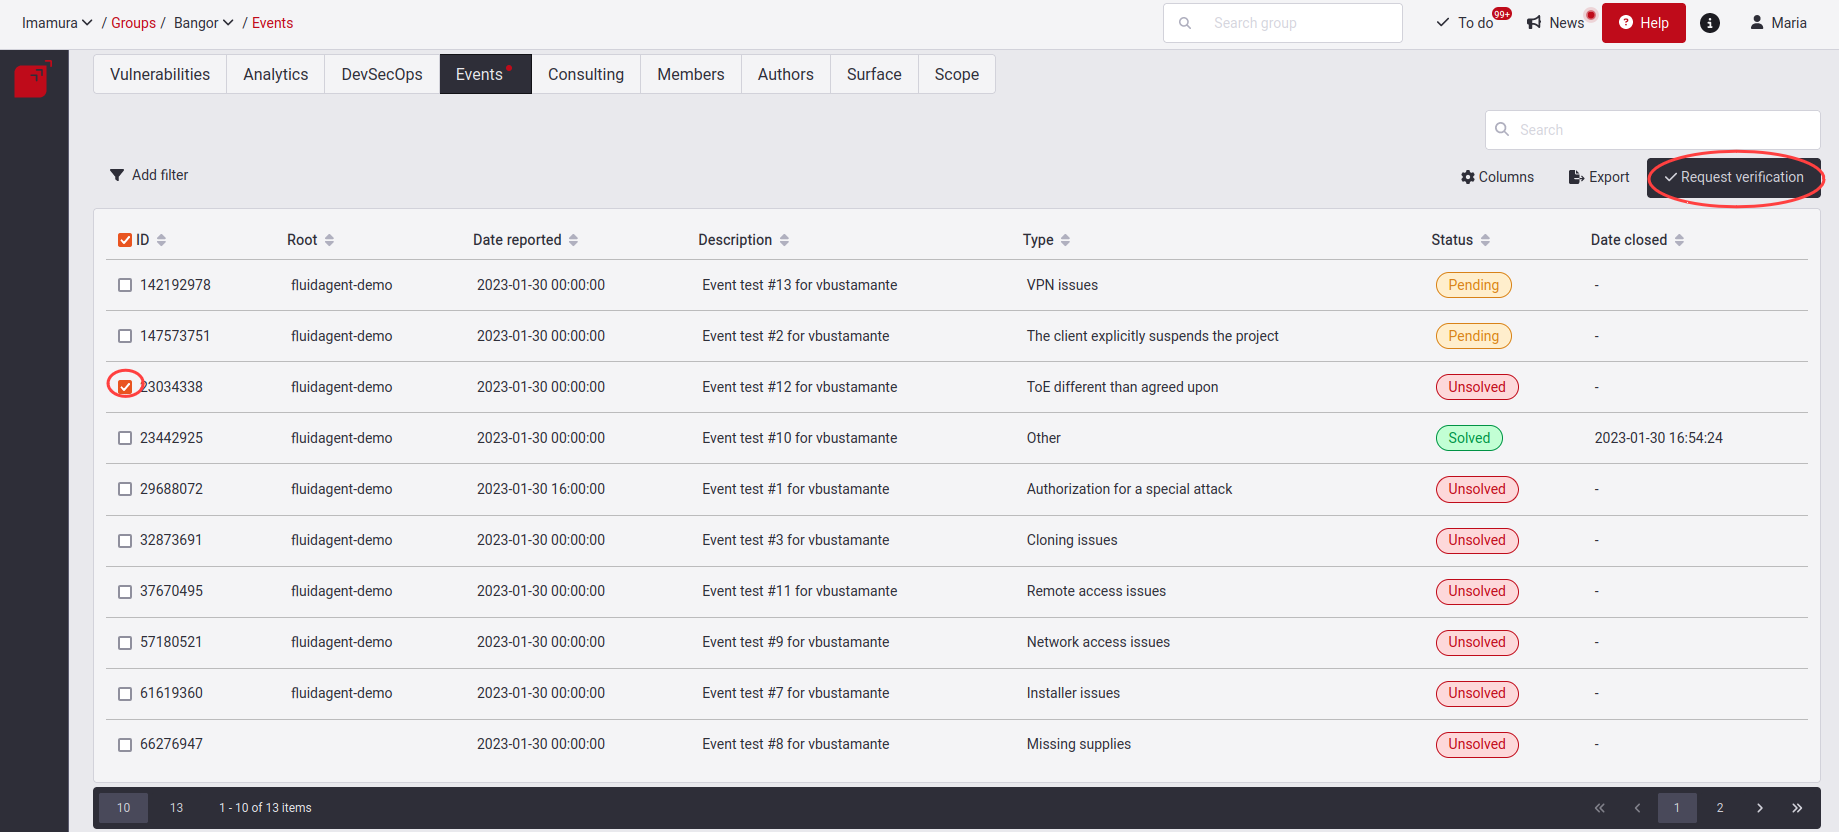
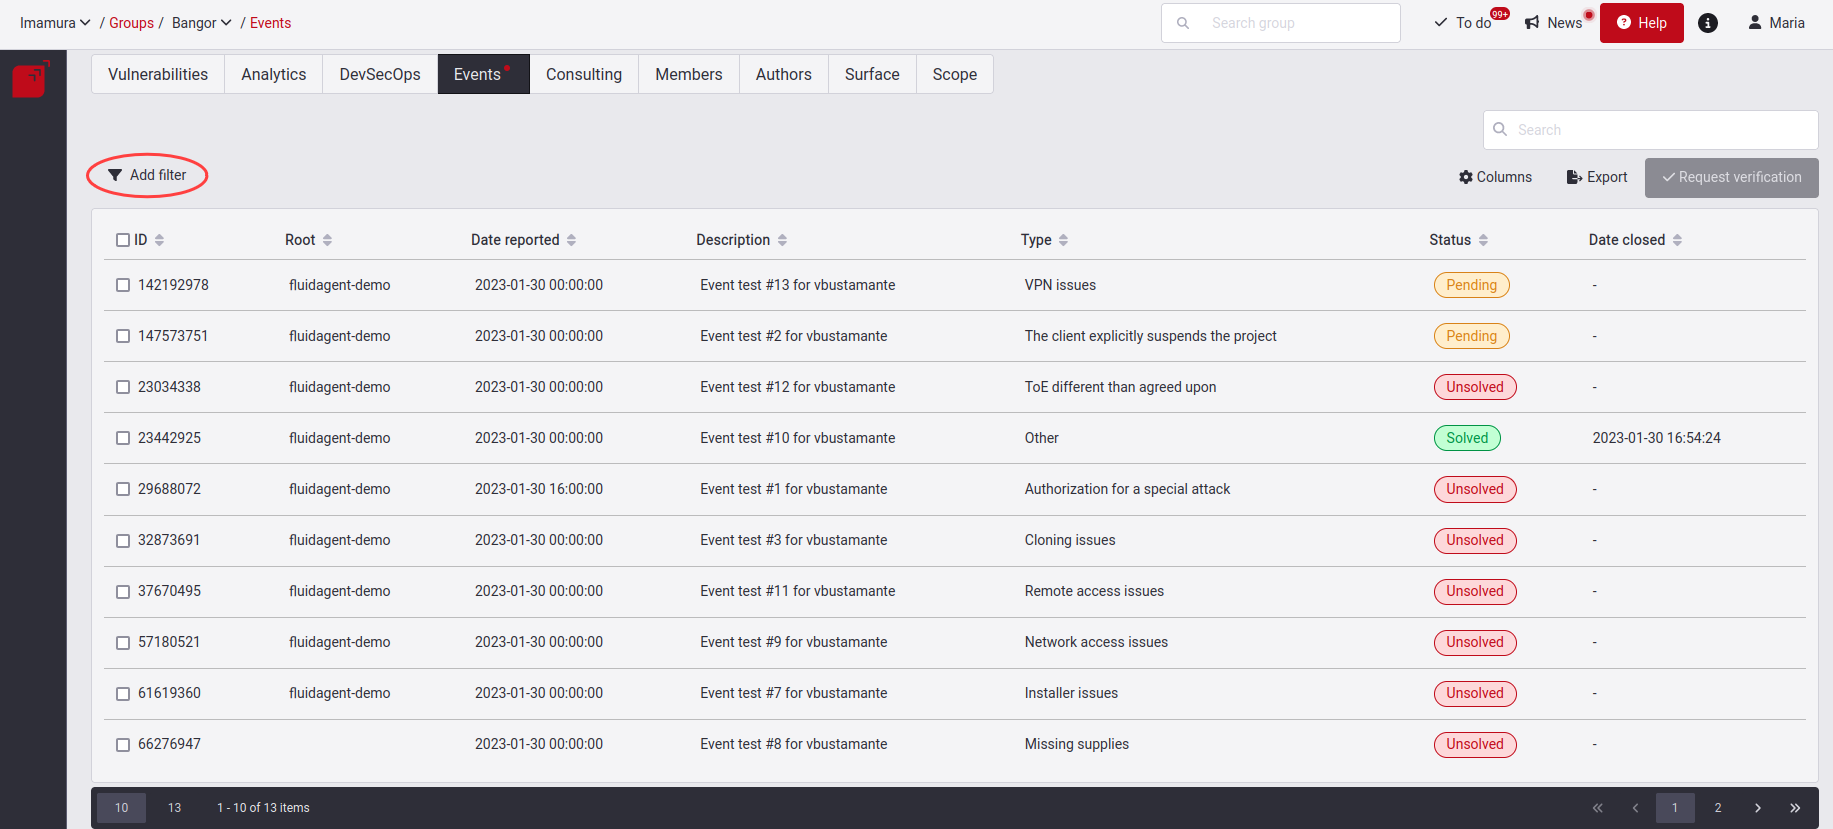
Know your Events table

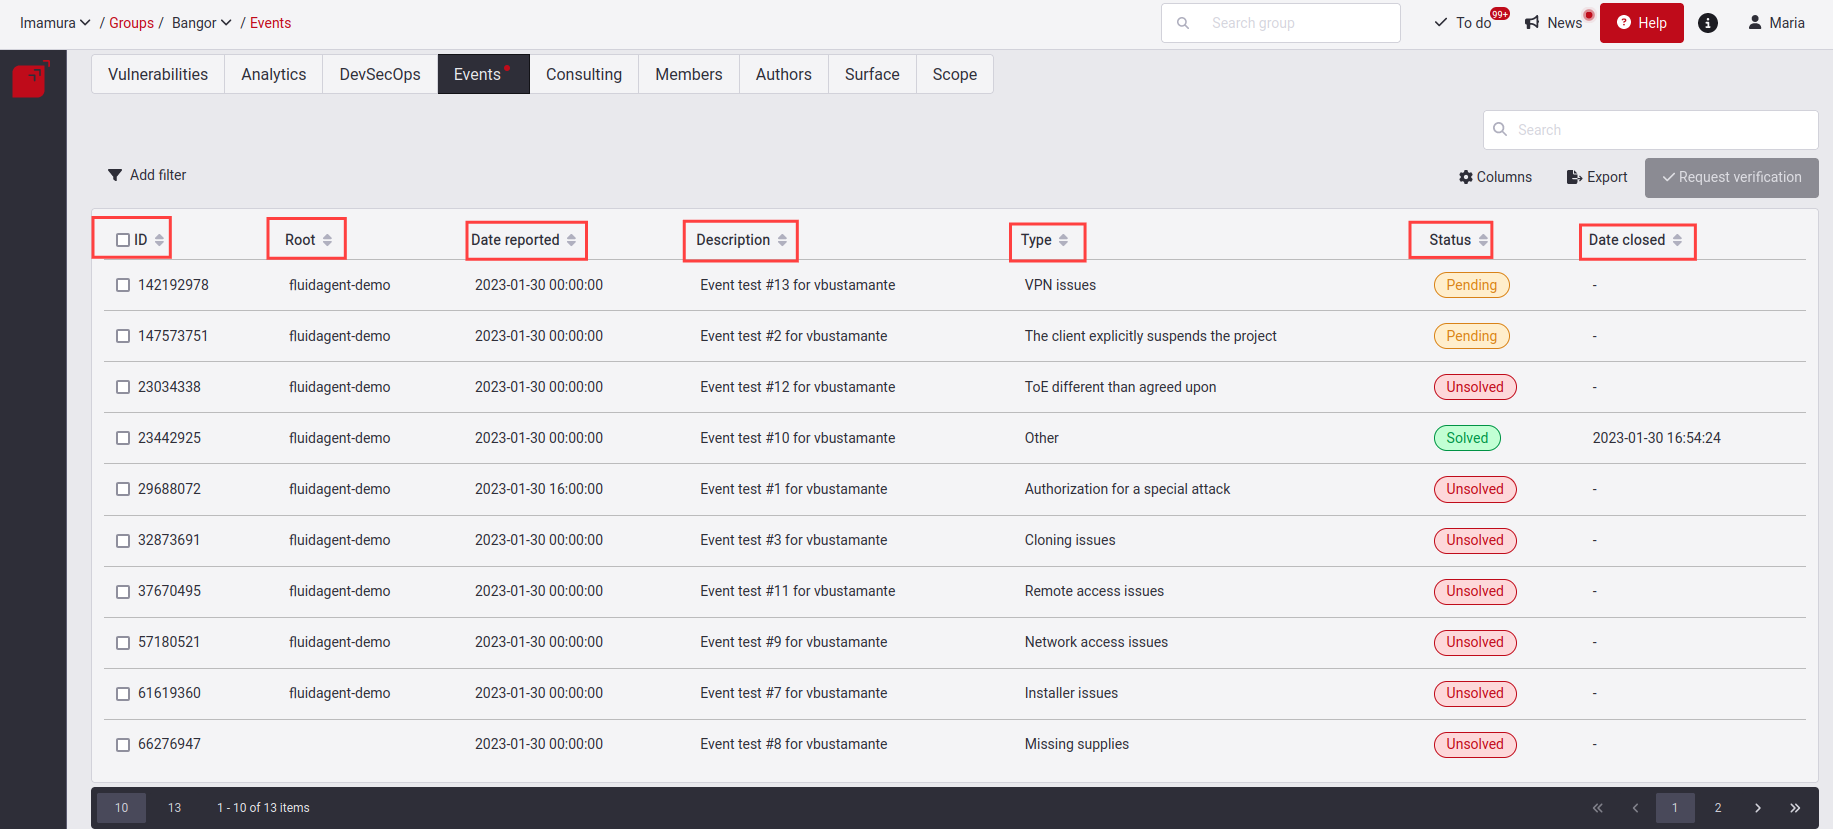
- ID: The event’s unique identifier
- Root: Refers to the nickname of the Root
- Date reported: When the event was reported
- Description: The problem that, according to the hacker, impeded, or still impedes, their security assessments
- Type: The category in which the problem falls (read below the descriptions of these types)
- Status: The condition of the event, which can be "Solved," "Pending" or "Unsolved" (read below about these status categories)
- Date closed: When the event was solved, if it was; otherwise, only a hyphen is shown
Types of Events
A reported Event can have different causes. Here are all the different types.
Authorization for a special attack
A specific test needs to be performed, which may affect availability or integrity and requires permission by the customer to carry out a specific test.
Cloning issues
Some repository does not clone.
Credentials issues
No credentials exist, or those that do exist are not valid.
Data update required
Reset user credentials or data changes to consume a service.
Environment issues
Installer issues
Unable to install or error when installed on mobile or desktop application.
Missing supplies
Network access issues
Other
Any other problems that do not fall into the above categories.
Remote access issues
Problems with connection methods. For example, when access to environment is not possible.
The client cancels a project milestone
Customer cancels projects.
The client explicitly suspends the project
The client suspends the project for a specified time or excludes a particular part of the ToE.
TOE different than agreed upon
In Continuous Hacking, there are services different from those agreed upon or non-existent functionalities.
VPN issues
Failures on the VPN connection.
Status of the Event
The status of an Event can be either of these three: Unsolved, Pending and Solved.
First, when an Event is reported, it will have the Unsolved status.

Here you have to give the solution to this created event. When you have implemented or decided a solution for the Event, click on the checkbox on the left and click on Request verification. Read further below what the steps are for requesting this verification. At this moment, the Event will enter the Pending state, where you will be waiting for the verification that the supplied solution is effective.
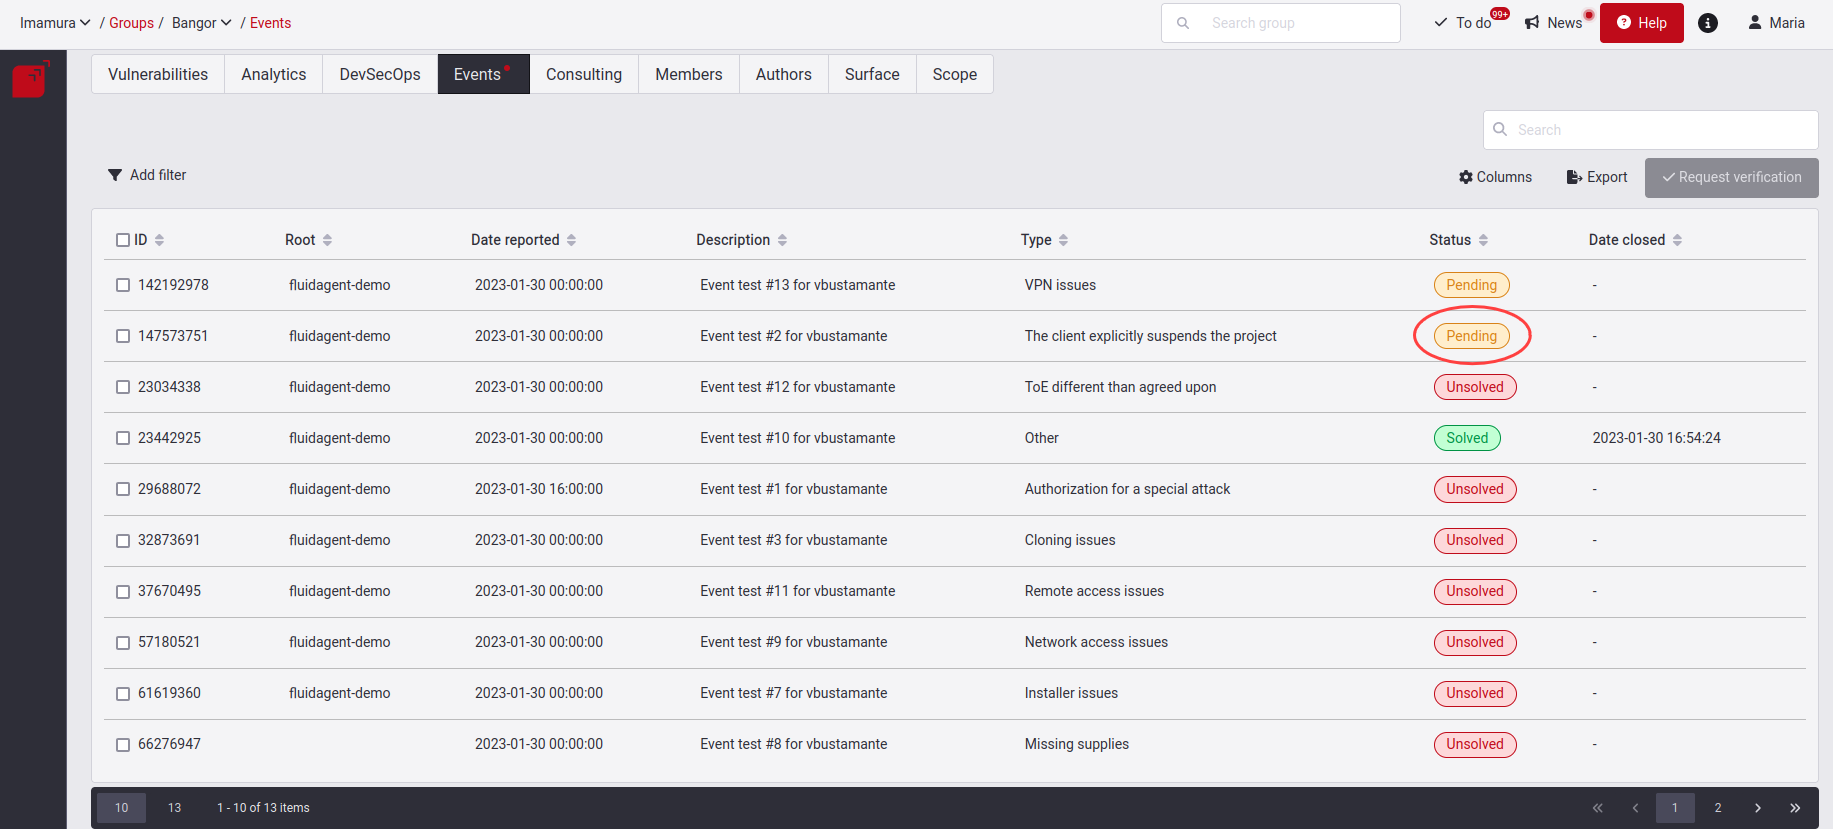
When validated and the solution successful, it will move to our third Solved state.
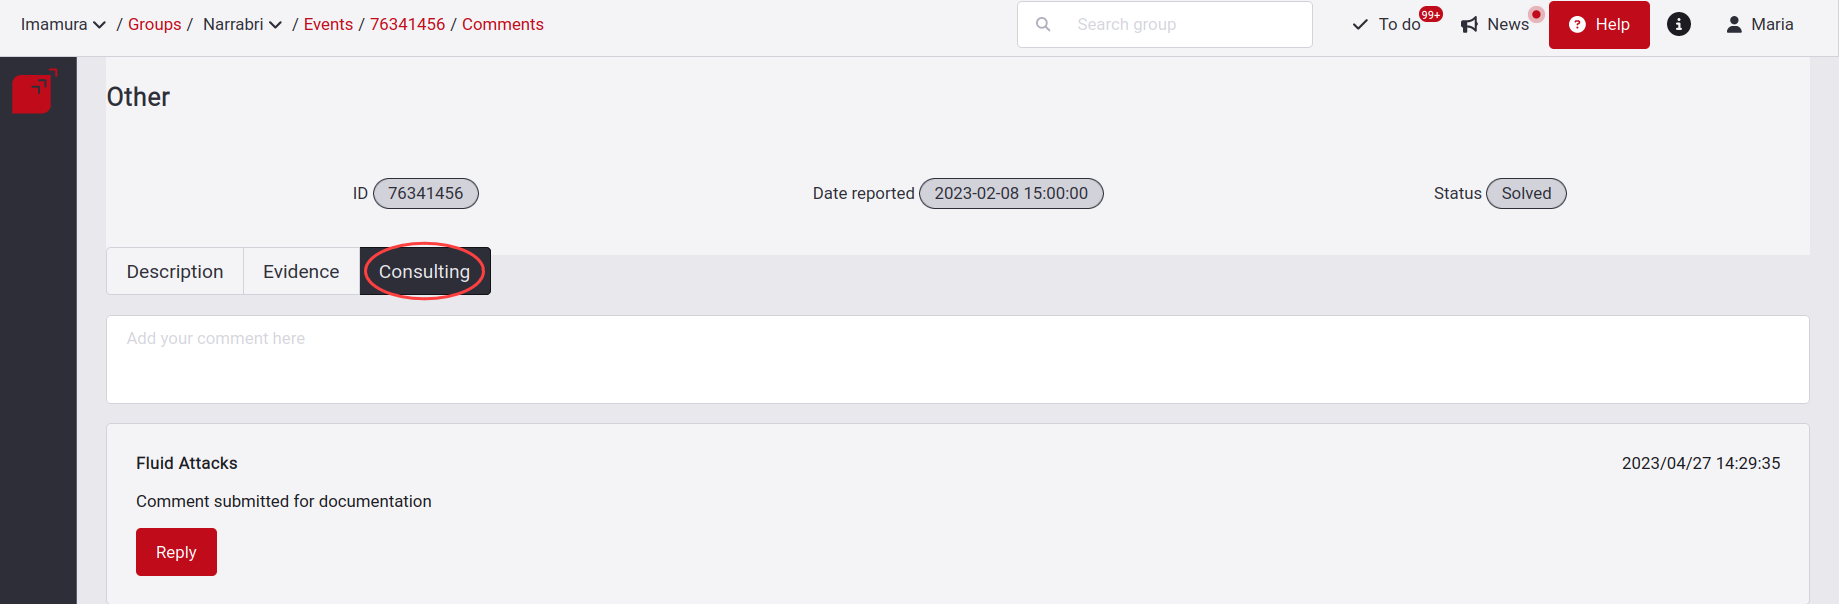
If this solution does not work, the event will be set to Unsolved status, and you will receive a notification where you will see a comment from the analyst. These comments will be sent to you as a notification, but you can also see them in the Consulting tab.
Please take notice of the event indicators below:
- Red dot: This will appear if at least one event is in the Unsolved state.
- Orange dot: This will appear if at least one event is in the Pending state. However, there cannot be any event in the Unsolved state.
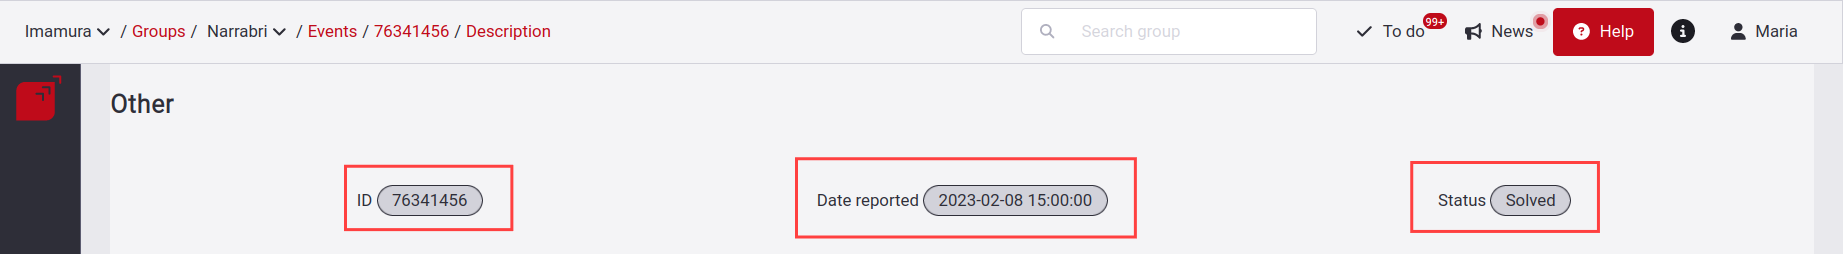
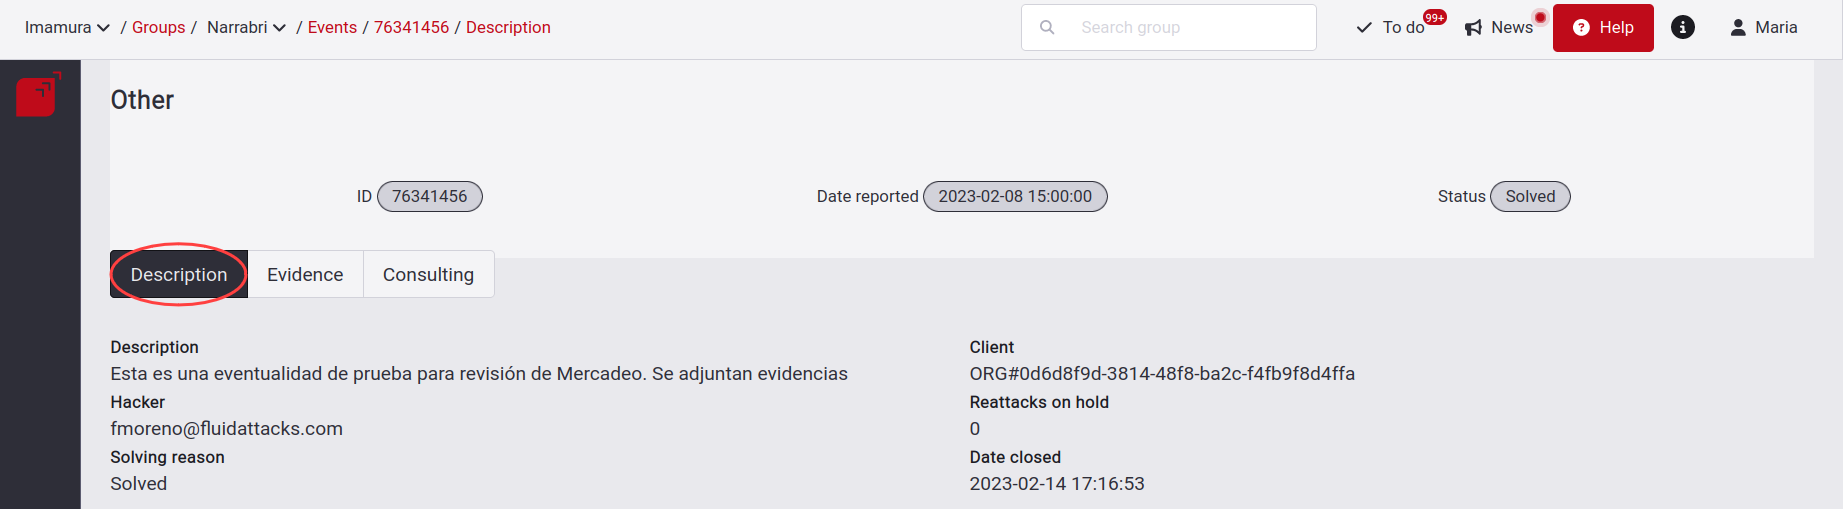
View Event details
It also has an information header that shows the title of the event type along with its ID, the Date reported, and the current Status of the event.
Description
In Description, you find why the event was reported by one of our hackers along with their email, the site where it is present and the number of components affected.
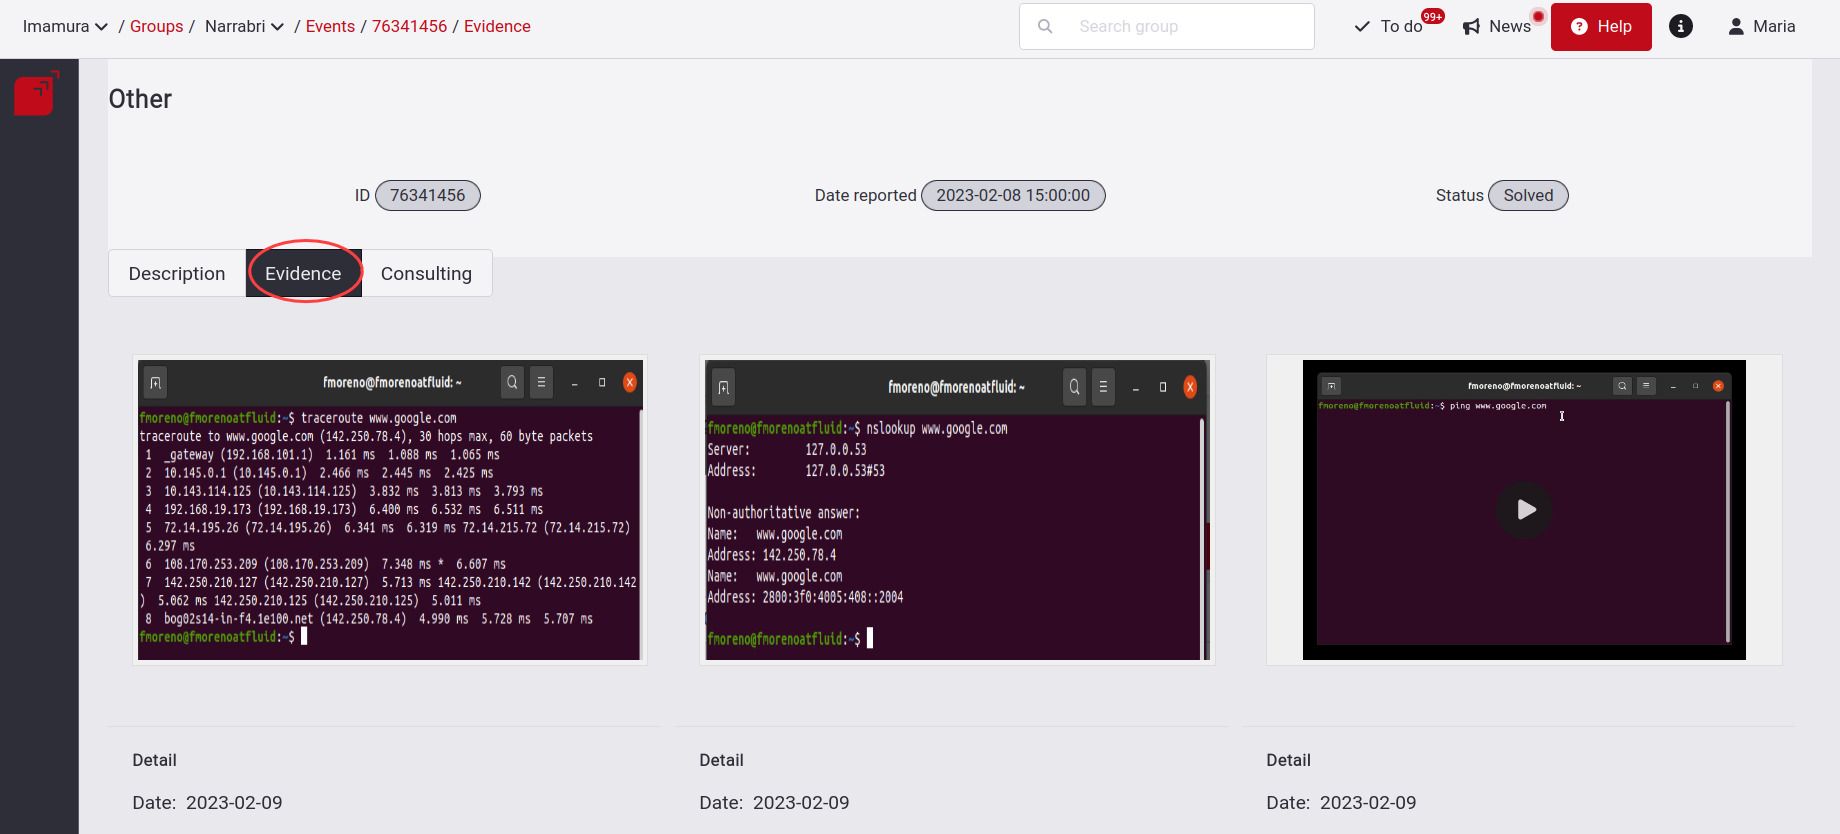
Evidence
Next is the Evidence tab, you find images with .png and .jpg extension and videos with the WebM extension, helping us to understand the reported Event.
Consulting
Request a verification that the Event is solved
When you click on it, you will get a pop-up window where you will have to explain the justification of how you solved this event; remember to enter at least ten characters, followed by clicking on the Confirm button.

Filter the Events table
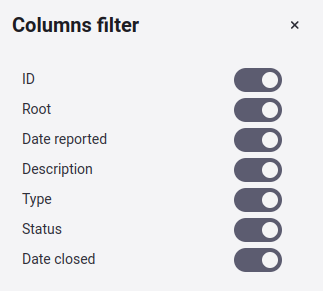
Show or hide columns of the Events table
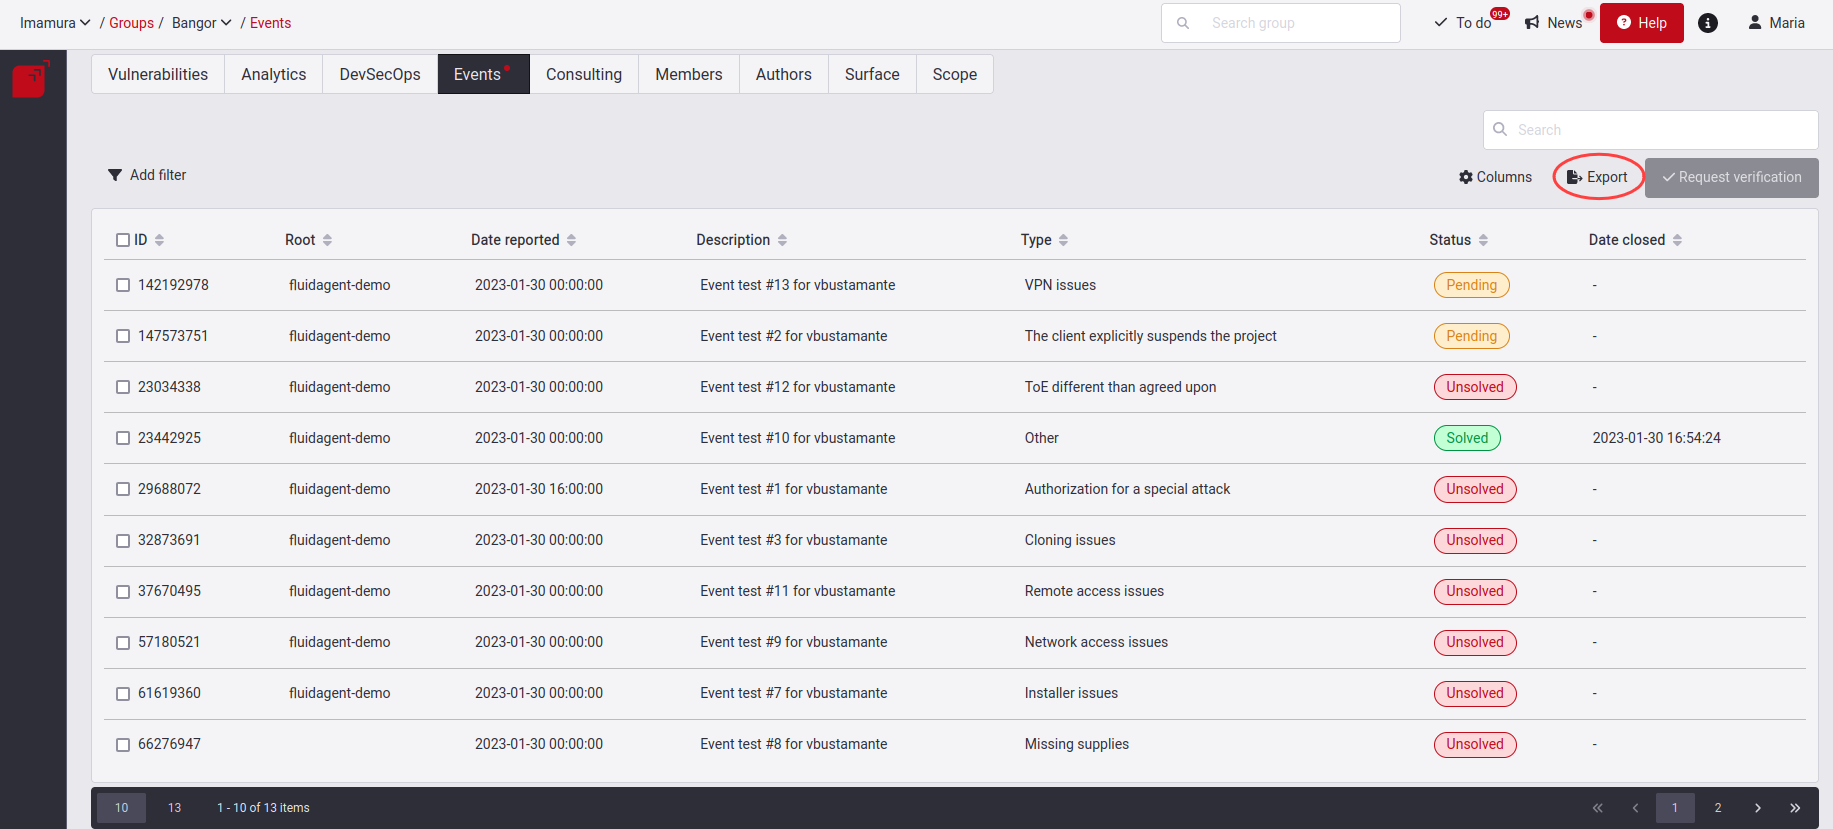
Export the Events table
Search the Events table
The search bar filters the information contained in the rows of the table.
