Know your Groups section
Groups correspond to single projects that our clients create to manage their vulnerabilities separately. You may have several groups corresponding to separate applications, infrastructure or source code. When you create a group, the ethical hackers at Fluid Attacks start assessing it in search for vulnerabilities.
Scope overview
In the Groups view, you will find Scope Overview, which will give you global and visible information on the total of repositories and authors you have in Fluid Attacks' platform. You will find the following fields:
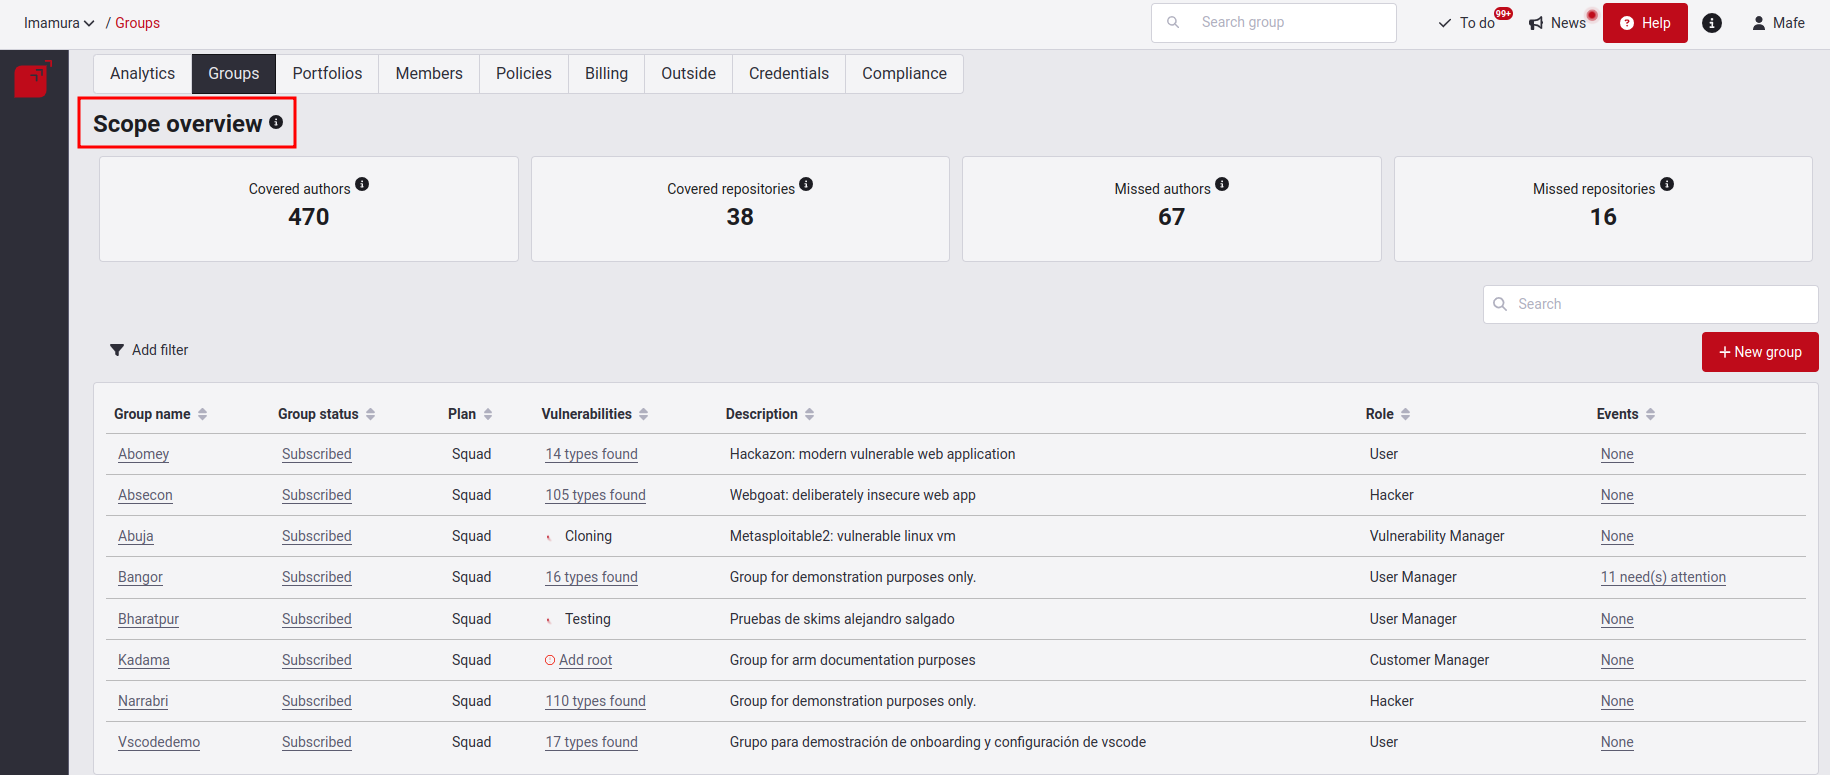
- Covered authors: Total number of authors who have made commits to the repositories.
- Covered repositories: Total number of repositories at the organization level that are added for the source code analysis.
- Missed authors: Total number of authors who have made commits on the missed repositories (repositories Outside).
- Missed repositories: How many repositories are not included in the source code analysis. (You can find these repositories in the Outside section).
Clicking on any of these four boxes will redirect you to the Outside section. If you want to know more about this section, click here.
Group table
In the group table, you find all the groups you have access to within your organization. This table has seven columns, each of which allows you to organize the list content alphabetically (either ascending or descending) if you click on the arrows next to each title.
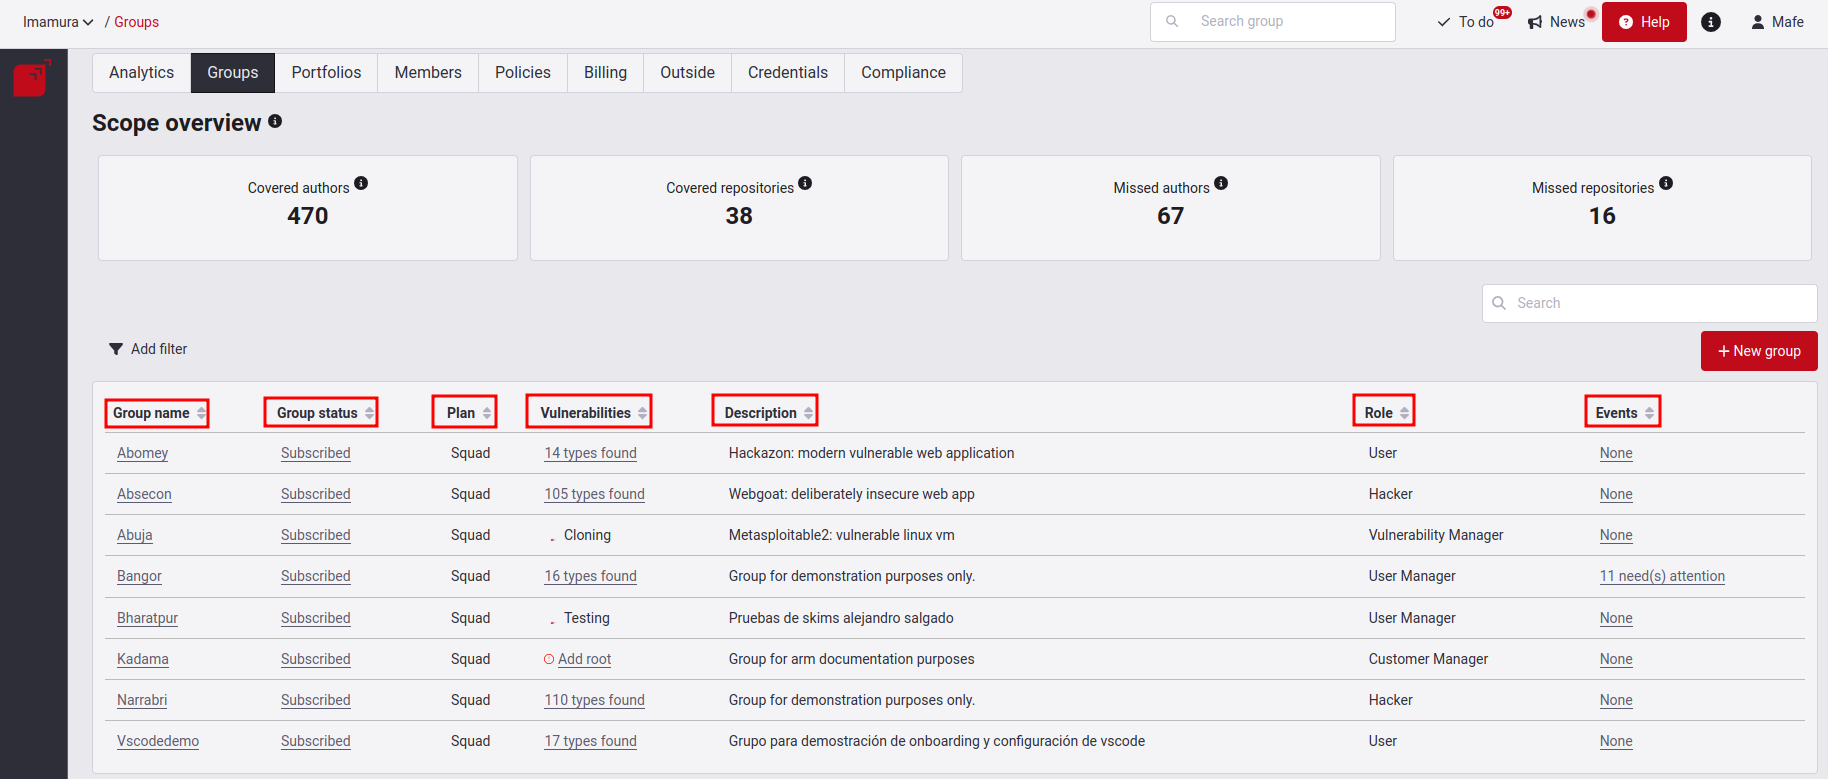
You find the following information:
- Group name: The first column shows you the names of the groups.
- Group status: You can find three options: Subscribed, Free-trial and Suspended. Subscribed is when the method of payment is valid, Free-trial you find it when the group is part of Enrollment, and Suspended means payment methods are being analyzed, or the Free-trial has been completed.
- Plan: You can see the plan to which each group belongs.
- Vulnerabilities: It will show the different statuses managed by the inputs in that group or the total number of vulnerabilities detected. The statuses are:
- Add root: When a user creates a new group but hasn't added a root.
- Cloning: A repository is being cloned.
- Cloning error: There is an error in the cloning process. Remember that for this status to appear, all the group's roots have failed.
- Testing: When a root (previously added and cloned) is being tested.
- No vulnerabilities: No vulnerabilities are found in the root. (Apply for Essential plan)
- # types found: The total number of vulnerabilities detected in that group.
- Description: The next column gives you the short descriptions the groups received at their creation.
- Role: The role within each of them.
- Events: The last column tells you how many unsolved events each group has (to learn more about this column, we invite you to click here).
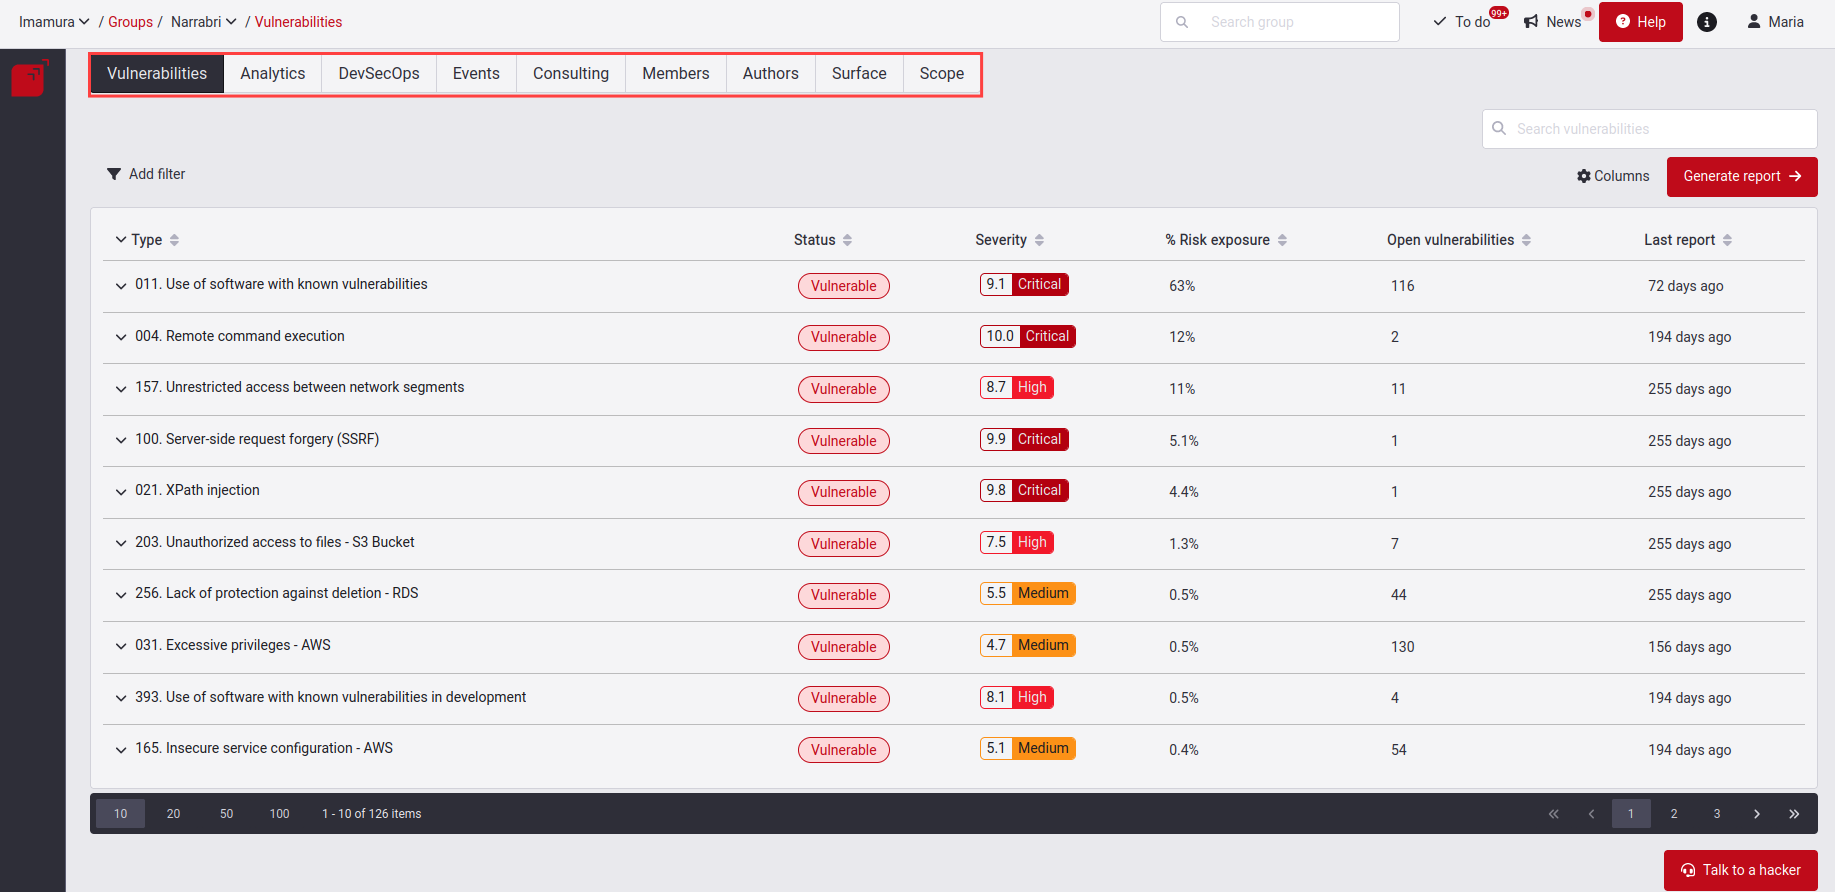
When you enter a group, following the link in its name, you can see its detailed information in different subsections, which will vary depending on your role and the plan you have for that group.
Create a new group
 Role required: User Manager
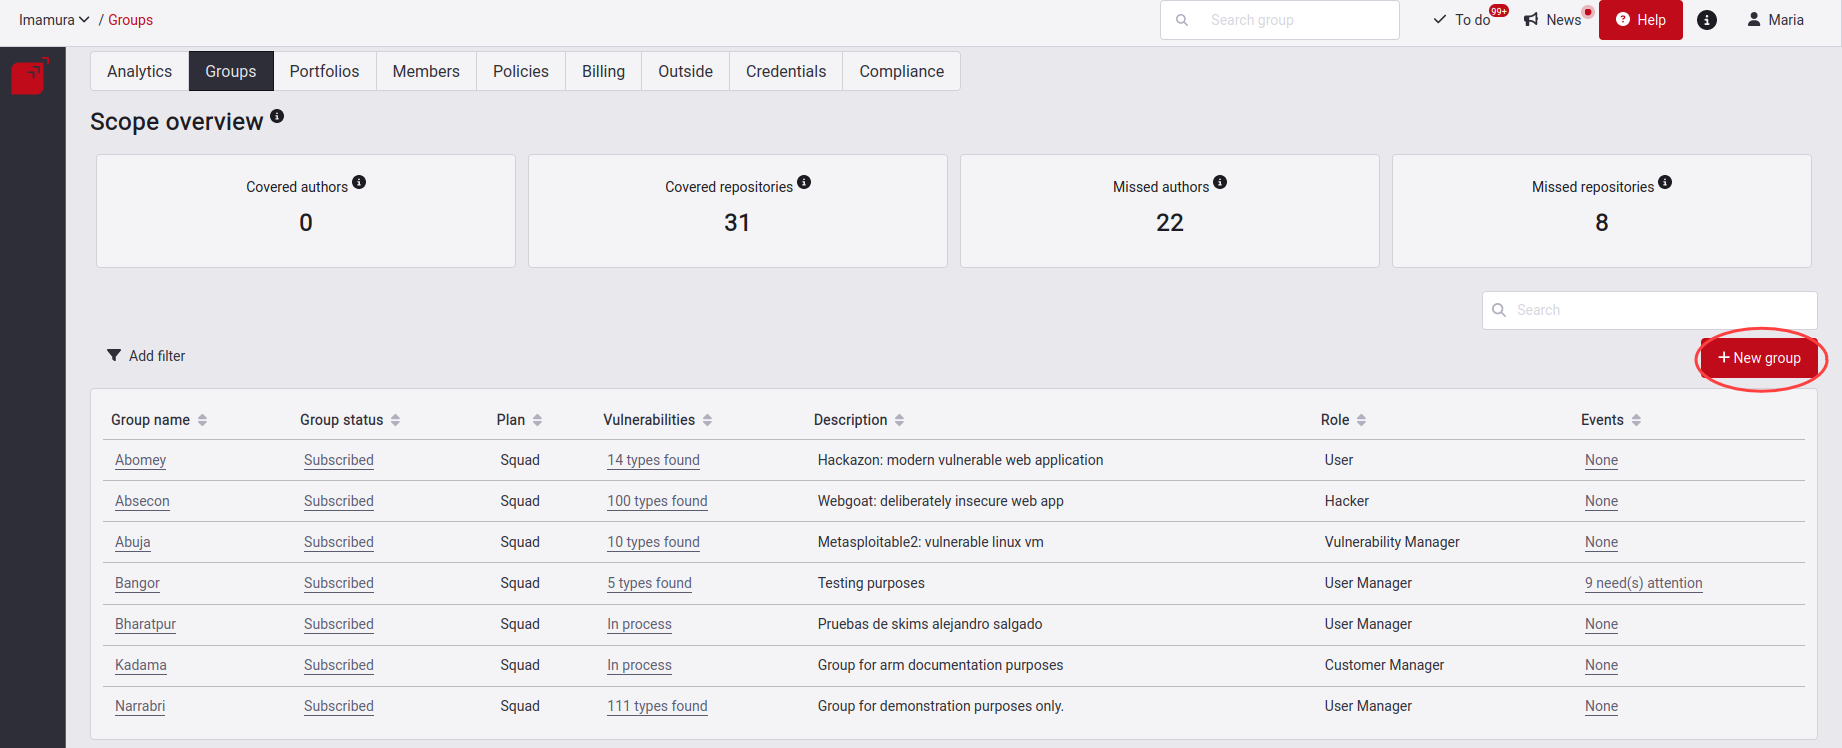
Filter group table data
Role required: User, Vulnerability Manager or User Manager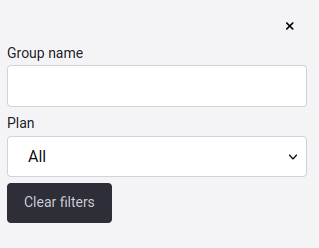
Search the group table
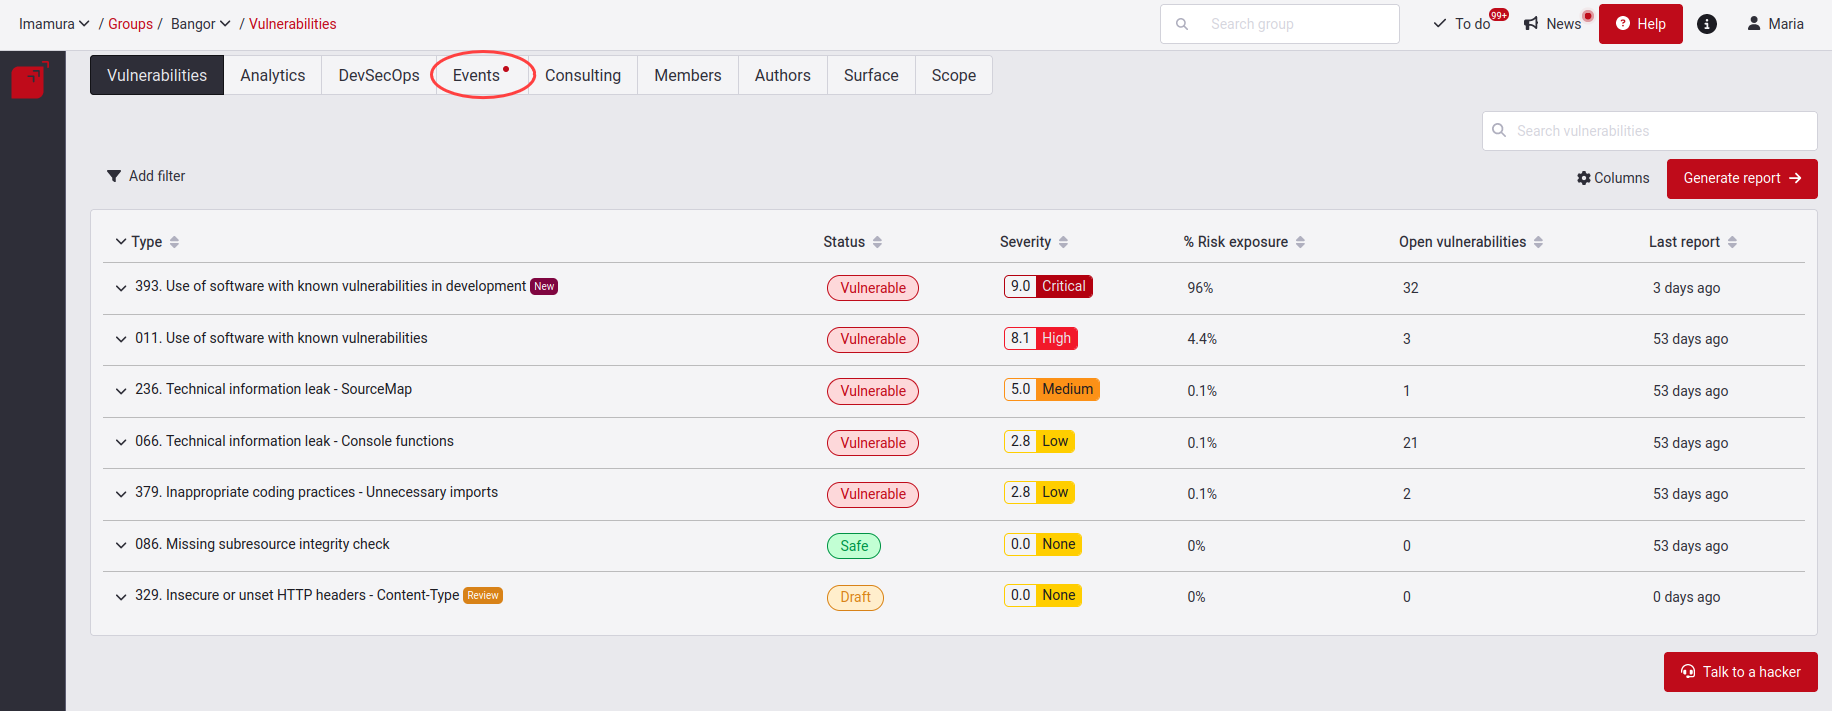
See events impeding tests in groups
Role required: User, Vulnerability Manager or User Manager
When you enter one of the groups with at least one unsolved event, you can notice a red dot in the Events tab, which works as a warning signal that something requires your intervention.
When you click that tab, you see the event table with a Status column showing for each event whether it is solved (in green), unsolved (in red) or pending (in yellow).
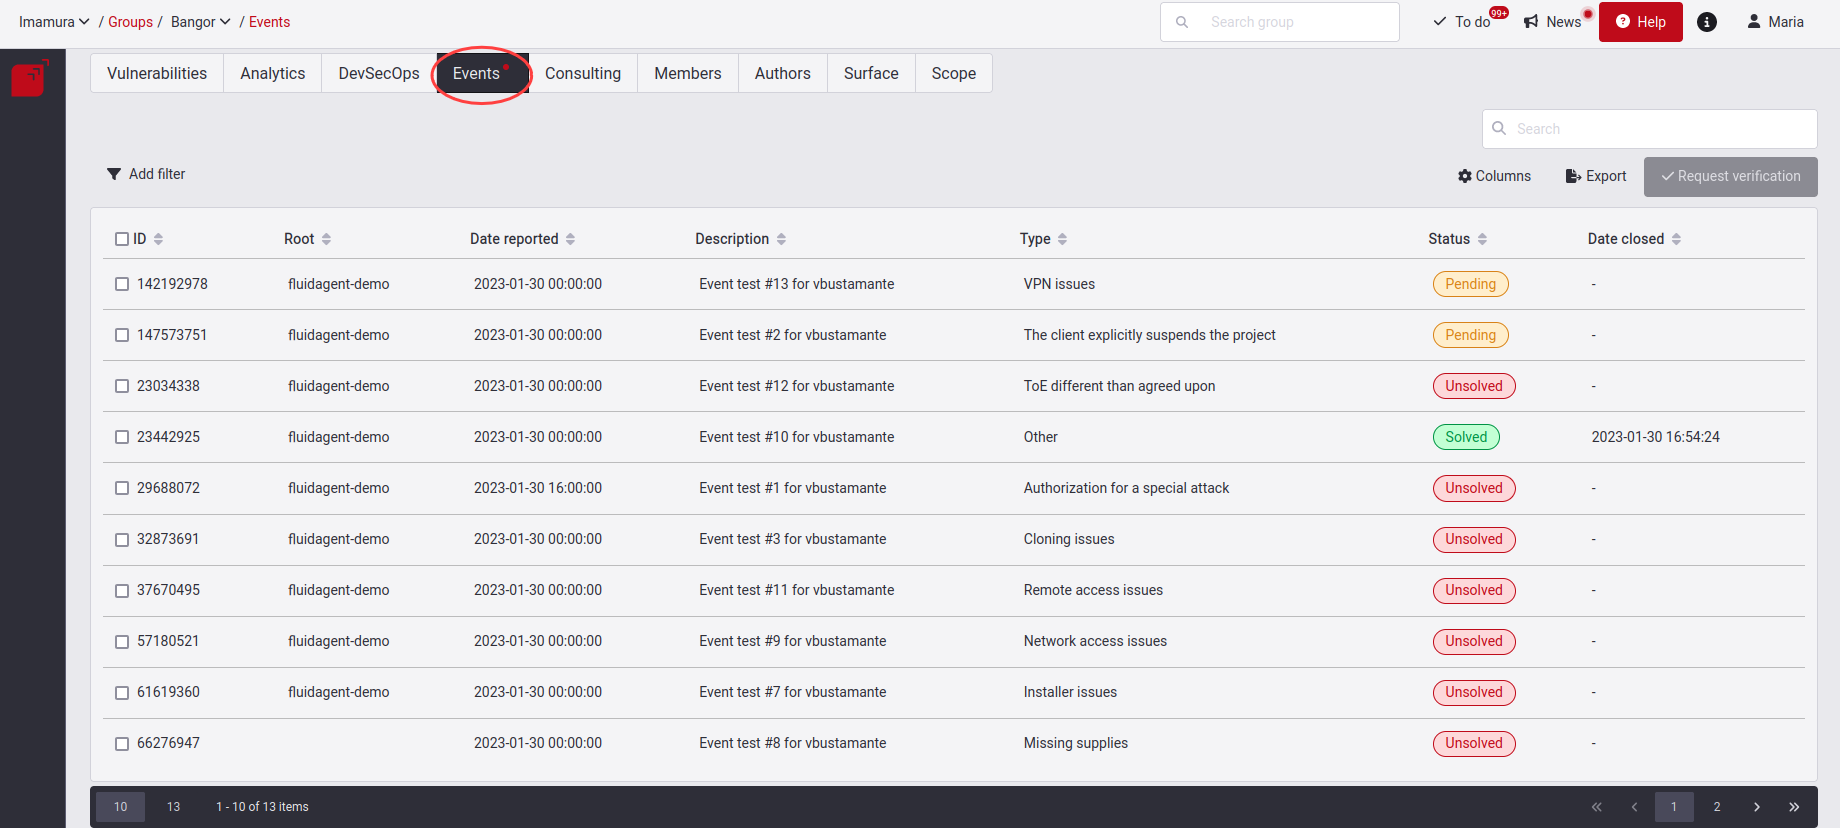
If you want to know more about the event section, you can enter here.