DevSecOps Agent
We have a component called the DevSecOps agent, which is an essential element for implementing DevSecOps in projects. The agent is included in CI/CD (Continuous Integration/Continuous Deployment) environments as a security gate, preventing vulnerable code from reaching production. Any change to the Target of Evaluation is continuously verified. The agent verifies the status of vulnerabilities and breaks the build to force the remediation of those that are open and unaccepted.
In the Policies section on the platform, you can select and configure the conditions or policies that the agent must validate for breaking the build.
Agent Table
The DevSecOps section has a table showing a cumulative record of the execution of our DevSecOps agent in your pipeline. This table contains dates, numbers of vulnerabilities, types of testing, repositories assessed, among other data. You can access more details about each execution by clicking on the corresponding table row. These details include a new table with each vulnerability and its exploitability, status and location, among others.
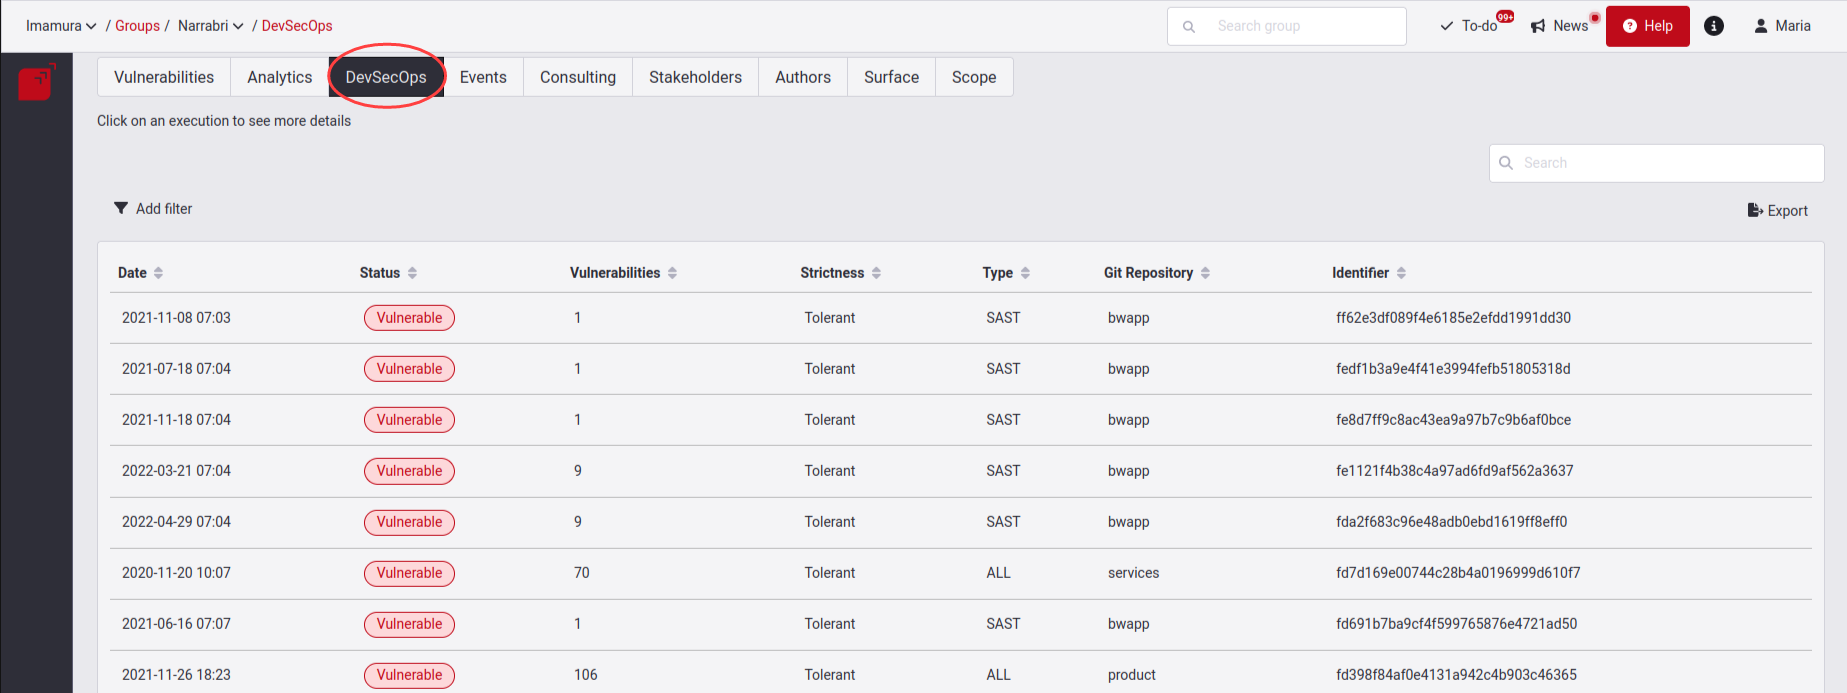
In total, we have seven columns which are described below:
- Date: The date which our DevSecOps agent was executed in your pipeline.
- Status: The agent handles the two states: Vulnerable and Secure. The Vulnerable status is given when the agent detects at least one open vulnerability. The Secure status is given when there is no open vulnerability affecting the transition to production.
- Vulnerabilities: The total number of open vulnerabilities identified by the Agent during the execution.
- Strictness: The agent handles the two modes: The Strict mode denotes that in that execution the agent was set to deny the deployment to production (break the build) when it detected at least one open vulnerability in the pipeline. The tolerant mode denotes that in that execution the agent was set to only give warnings when it detected open vulnerabilities in the pipeline, allowing deployment to production.
- Type: You can find three options: SAST, DAST and ALL. These options correspond to what the agent recognized as the techniques with which vulnerabilities were detected, ALL being with both SAST and DAST.
- Git repository: The name of the repositories evaluated by the agent.
- Identifier: Is the Agent's run identifier number.
Functionalities
In the DevSecOps section, you can see the following functionalities:
Filters
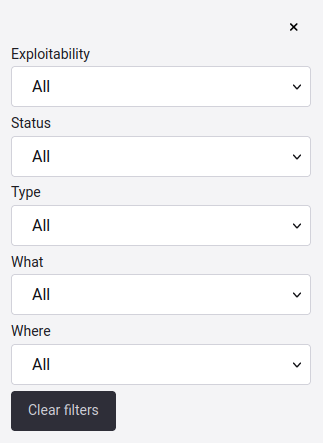
In the DevSecOps section, there are five filters available for the table. You can find them on the top left.

Export button
In the DevSecOps section, there is the Export button on the top right. Clicking on this button, you can download a CSV (comma-separated values) file containing all the information in the table of this section.
Search bar
The search bar filters the information contained in the columns of the table.
Execution details
Clicking on any of our DevSecOps agent executions, you will see a pop-up window that provides more detailed information about that execution.

This window offers us the information that the agent table gives us including the two policies that you specified in policies section which are: DevSecOps: Days before agent starts breaking the build for new vulnerabilities represented by Grace period and Severity Threshold refers to the policy DevSecOps: Minimum CVSS 3.1 score from which agent breaks the build for open vulnerabilities. You can enter here if you want to know more about the policies.
You can also see in this view two tabs: Summary and Execution log.
Summary
This tab shows a table that provides you with concise and clear information about all the vulnerabilities reported by our agent in a specific execution. You can see each vulnerability's location, exploitability, status and type (according to the technique that detected it).

Summary Table
It has the following columns:
- Exploitability: The exploitability score based on the CVSS.
- Status: The state reported by the agent.
- Type: You can find two options: Static Application Security Testing (SAST) and Dynamic Application Security Testing (DAST).
- What and where: Where exactly is the vulnerability.
Columns filter
Clicking on the Columns button, you can open a window to show or hide columns from the table, depending on the data you want to observe.

Filters button
Clicking on the Filters button, you can use to restrict the set of information visible in the table.
Execution log
You can get the execution log in a JSON format by either using the
--output CLI option and outputting the report to a file, or by querying
the jsonLog attribute of forcesExecution in our Platform's API
We know that sometimes the log content that the agent gives us is not so explicit for its interpretation. In this section, we want to provide you with tips and key information so you can understand it better and get the best out of the data it gives us.
First,
you have to understand that depending on what
parameters
or arguments we add to our execution,
we will get the information.
For this example,
we will analyze this execution with the following arguments:
**-vv, -static, and --lax.**
If you want to know what other parameters you
can pass to the execution of the agent,
you can enter them
here.
When you run the agent, you can see the result of the execution from Fluid Attacks' platform in the tab called DevSecOps, or you can also see it from your CI/CD or in the terminal of your local machine.
You first see general information about
how the agent was executed with the
INFO tag.
Next,
you can see an informative
WARNING which informs you if you specify
the repository name;
follow the other INFO tag,
which tells you how the whole run was.
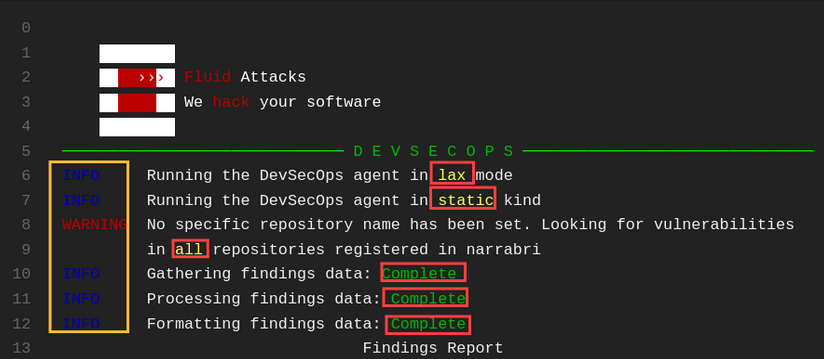
Next,
you will find the Findings Report,
which will give you a report of the
vulnerable Findings that were found.
Note that it will provide different findings
depending on how you ran the agent.
Here is a brief explanation of its contents.
- Title: Title of the vulnerability typology.
- URL: The link that redirects you to the reported location.
- State: The state of that finding which can be vulnerable or safe.
- Exploit: This will give us an exploitability status that can be High, Functional, Proof of concept, or Unproven.
- Severity: Severity level according to the CVSS of that location.
- Vulnerable: Total amount of vulnerabilities that are in Untreated status.
- Safe: Total amount of vulnerabilities that are in safe status.
- Accepted: Total amount of vulnerabilities that are in Accepted treatment.
- Vulns: Vulnerability Locations.
- Type: According to how you ran the Agent, either Dynamic / Static.
- Where: The file's path where the vulnerability in the Untreated state was found.
- Specific: In which line of code the vulnerability is found.
- State: The state of this vulnerability.
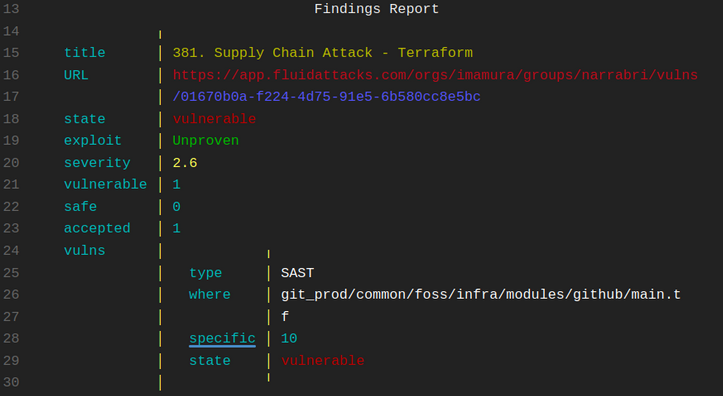
This way, you will see the content of your report, where according to a specific location, it will give you this information.
Once the report is finished,
you will see a summary that
tells you the total number of vulnerabilities
with Untreated status and those with accepted treatment.
It also tells you how long it took to execute the agent.

Remember that your summary's content may change according to the parameters with which you ran the agent. You may also get information on what criteria will be applied to break the Build; it is re-emphasized that it is given according to the stipulated Policies.