Results
At Fluid Attacks we decided to test our primary automated software vulnerability detection tool against the OWASP Benchmark test suite.
This detection tool is included in all of our plans of the Continuous Hacking service.
This is how our scanner compares to other vulnerability detection tools measured against the test suite:
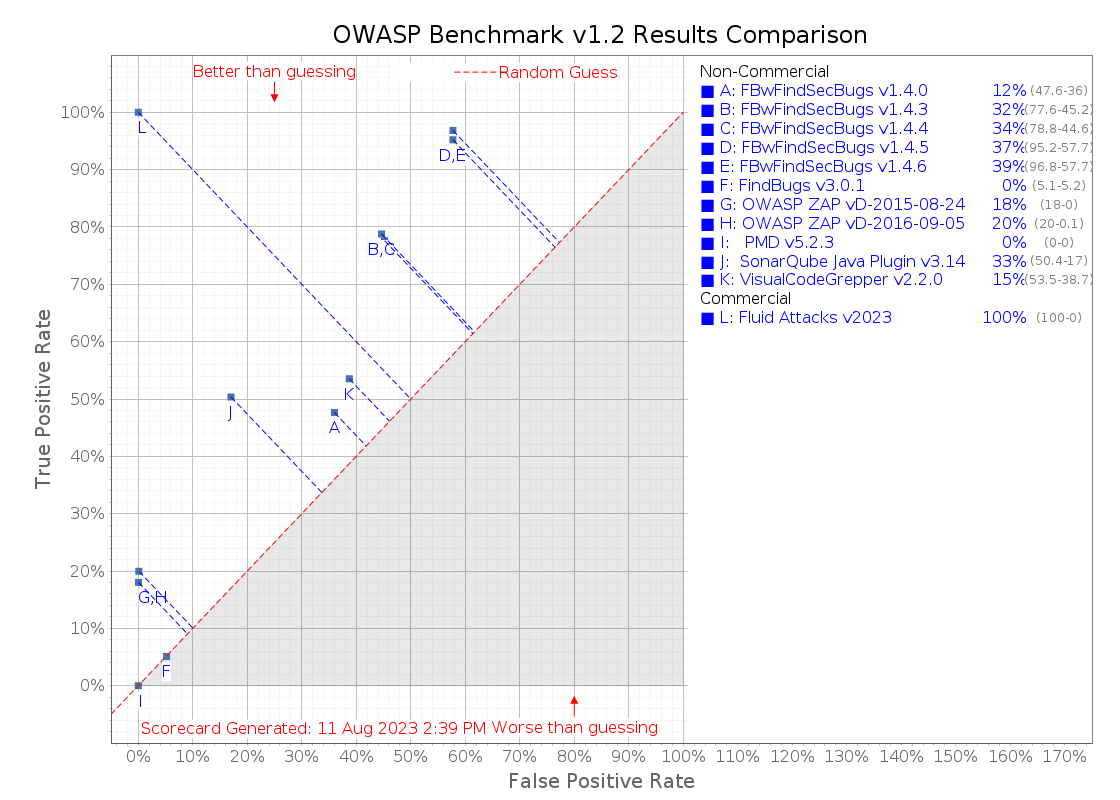
Image generated on 11/08/2023
As you can see, our automated vulnerability detection tool scores a clean 100% True Positives Rate and 0% False Positives Rate.
This accounts for a total OWASP Benchmark Score of 100%, which is four times higher than the commercial (paid) average score included in the study, and more than two times higher than the best non-commercial (free) vulnerability detection tool.
What is most important, Fluid Attacks cares about what you care:
- Finding all the vulnerabilities before they impact your business
- Keeping your team fast with zero false positives.
Keep reading for a more detailed explanation of what these results mean.
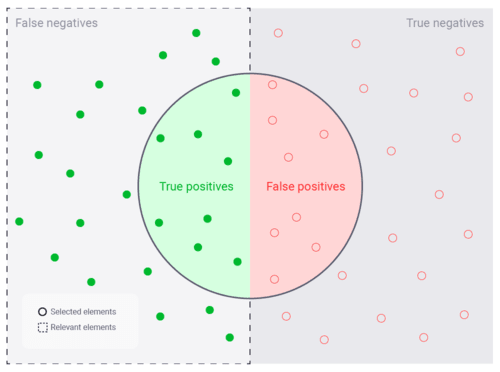
Statistically, the results of a vulnerability detection tool can be divided into the following groups:
-
True positives: Real impacts to your business reported by the tool.
Very nice! This is what you are looking for.
-
False negatives: Real impacts to your business not reported by the tool.
Undesirable! The tool fails to identify vulnerabilities. This gives you a false sense of security and you will likely deploy undiscovered vulnerabilities to production.
-
False positives: False impacts to your business reported by the tool.
Undesirable! The tool makes you waste time in filtering the false information out.
-
True negatives: False impacts to your business correctly omitted by the tool.
Very nice! You don't want a tool lying to you.
In the OWASP Benchmark this is measured with two key values:
- True Positive Rate (TPR) also known as sensitivity: How much of the vulnerable code is reported
- True Negative Rate (TNR) also known as specificity: How much of the safe code is identified as really safe
You can compare different tools by using the Youden's J statistic:
