Chart options
Last updated: Jun 30, 2026
Role required: User, Vulnerability Manager, Group Manager or Organization Manager
The charts in the Analytics sections of the platform have multiple tools to help you better understand the information, modify its presentation and download it. The following screenshot shows all the chart options:
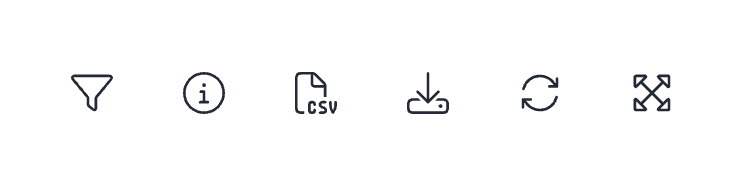
Simply hover your mouse cursor over the chart to reveal these interactive options, which we present below in the order they appear from left to right in the previous screenshot:
Filter
The filter option allows you to select one variable (e.g., amount of time, target of evaluation, or treatment) based on which you wish to limit the information you see in the chart.
This feature is available only for some of the charts.
Information
The information option allows you to go directly to the section of Fluid Attacks documentation where you find information corresponding to the chart or figure.
Download .csv
An option to download the chart information is in a comma-separated values (CSV) file.
Download .html
A different option is to download the chart as a Hypertext Markup Language (HTML) file.
Reload
The reload option allows you to reload the data of the current chart to resolve display issues or ensure you are viewing up-to-date information (keep in mind the analytics update schedule).
Expand
The expand option allows you to open the chart in a dedicated pop-up window for a closer look and more detailed analysis. This is particularly helpful for charts with complex data or visualizations that benefit from a larger display area.
Search for vulnerabilities in your apps for free with Fluid Attacks' automated security testing! Start your 21-day free trial and discover the benefits of the Essential plan. If you prefer the Advanced plan, which includes the expertise of Fluid Attacks' pentesting team, fill out this contact form.