CI Gate executions
Last updated: Jun 30, 2026
Fluid Attacks' CI Gate supports the DevSecOps methodology applied in your projects. This tool acts as a security gate within your continuous integration and continuous deployment (CI/CD) environments, preventing vulnerable code from reaching production.
That is, CI Gate monitors your software versions and, if it detects vulnerabilities that have not been remediated or accepted, automatically breaks the build to enforce their remediation, upholding your security standards.
The rules to break the build can be configured at the organization and group levels in the platform's Policies section. You can see details of each of CI Gate's executions in the DevSecOps section. This page guides you through it.
DevSecOps table
Your group's DevSecOps section features a comprehensive table that shows the execution history of CI Gate within your pipeline. A banner reminds you of your relevant policies currently applied in executions. Gain deeper insights into each execution by simply clicking on the corresponding date.

The following are brief descriptions of the table columns:
- Date: The date and time the CI Gate was executed in your pipeline
- Status:
Whether vulnerabilities were found in the execution:
- Vulnerable: Indicates that CI Gate identified at least one vulnerability that has not been fixed
- Secure: Indicates that no unfixed vulnerabilities were found
- Accepted vulnerabilities: The total number of vulnerabilities detected that are tolerated by your policies
- Unmanaged vulnerabilities:
The total number of vulnerabilities detected that break the build.
A vulnerability is considered unmanaged
when it meets all of the following conditions at once:
- it is open (not fixed or accepted as a risk),
- its severity score meets or exceeds the configured severity threshold,
- it has been reported for at least as many days as the configured grace period, and
- its age has not yet reached the configured days to technical debt, limit (when one is set).
- Strictness:
Whether breaking the build was enabled:
- Strict: CI Gate is configured to break the build if unmanaged vulnerabilities are detected, preventing deployment into production
- Tolerant: CI Gate only issues warnings for unfixed vulnerabilities, allowing deployment into production
- Type:
The security testing technique(s)
with which the vulnerabilities were detected,
where the following values are offered:
- STATIC: Static application security testing (SAST)
- DYNAMIC: Dynamic application security testing (DAST)
- ALL: At least one vulnerability was found through SAST and at least one through DAST
- Git repository: The nickname of the Git repository whose changes were scanned by CI Gate
- Identifier: The first eight characters of the CI Gate run's unique alphanumeric identifier
Filter the DevSecOps table
Role required: User, Vulnerability Manager or Group Manager
By clicking on the filters button, you access several options to limit the information shown in the table.


Search the DevSecOps table
Role required: User, Vulnerability Manager or Group Manager
Type in the search bar for the table to show you only the rows that contain your exact search term.

Download a report of the CI Gate executions
Role required: User, Vulnerability Manager or Group Manager
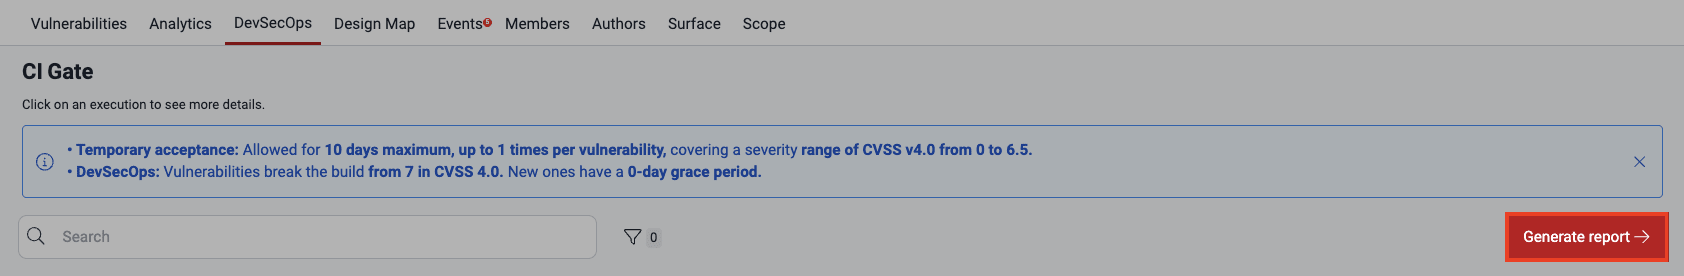
The platform allows you to download the information from the DevSecOps table as a comma-separated values (CSV) file. You just need to click on the Generate a report button. The report is made available in Downloads after a few minutes.

View CI Gate execution details
Role required: User, Vulnerability Manager or Group Manager
In the DevSecOps section, to gain more details about a specific CI Gate execution, click on its date.

A pop-up window appears, which provides a wealth of details about that specific run. You are presented with two tabs: Summary and Execution log.
Summary
The first data in Summary is that already present in the table, plus the indication of the value of three policies applied in that execution. All this data is again presented in the second tab.

Here are brief definitions of these policies:
- Severity threshold: The minimum CVSS score required for an unfixed vulnerability to break the build
- Grace period: The number of days during which newly discovered vulnerabilities do not break the build
- Days to technical debt: The number of days until vulnerabilities are considered technical debt and do not break the build
Below these details is a table with information about all vulnerabilities identified by CI Gate in its execution.

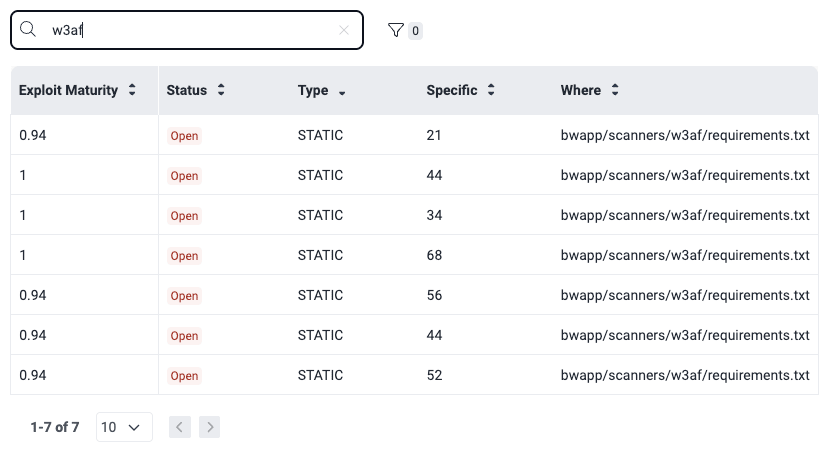
The table has the following columns:
- Exploit Maturity: The degree to which the vulnerability might lead to a successful attack, as measured by the CVSS v4.0
- Status: Indicates that the vulnerability is Open (is present) in the lines of code, inputs or ports
- Type: The security testing technique(s) with which the vulnerabilities were detected, as defined above
- Specific: The exact lines of code, inputs (e.g., password fields) or ports where the vulnerability was found
- Where: The file path where this vulnerability was found
You can apply filters to narrow down the information displayed in the table, facilitating targeted analysis.

Moreover, you can simply type what you are looking for in the search box, so that only the rows whose content matches your search are shown.
Execution log
You can get the execution log in a JSON format by either using the --output
CLI option and
outputting the report to a file, or by querying the jsonLog attribute of
forcesExecution in the platform's API.
Understanding CI Gate's execution log content can sometimes be challenging. This page section offers valuable tips and key information to help you interpret it effectively and extract maximum value from the data.
The following are the main elements to take into account:
-
Arguments: The log's content depends on the parameters or arguments used during agent execution. For illustration purposes, the screenshots below show an example of an execution with the argument
--strict.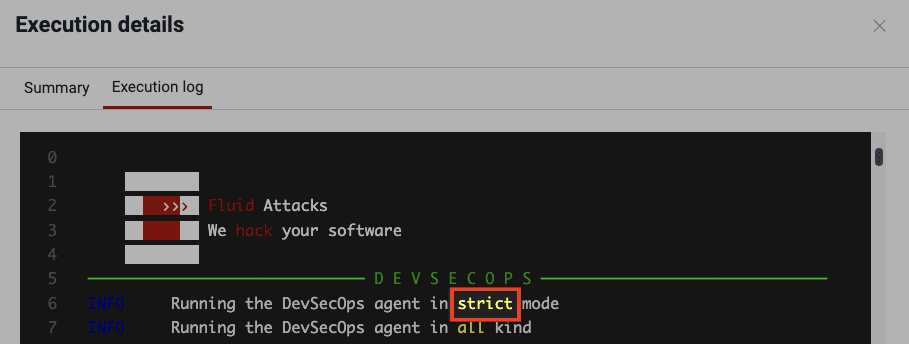
-
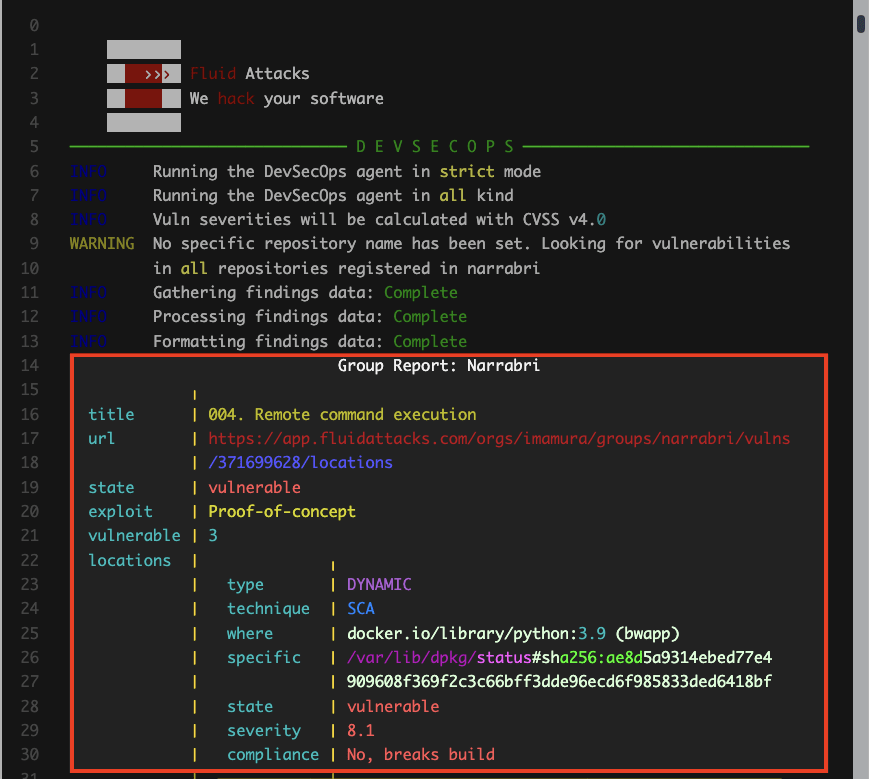
Report body: The core of the report is the detailed information about the detected vulnerabilities. Here is a brief explanation of the content characteristics shown for each of the latter:
title: The category that best describes the vulnerability, following Fluid Attacks' own classificationurl: The vulnerability URL on the platformstate: Indicates the condition of the group regarding the type of vulnerability, where it is vulnerable if the weakness is presentexploit: From the CVSS, probability of exploitation given the current state of techniques for it, exploit code availability, and actual exploitation "in the wild"severity: The type of vulnerability's severity score (from 0.1 to 10.0) using the CVSSvulnerable: The total number of unfixed vulnerabilitieslocations: The vulnerabilities that were identified, for which the following is informed:type: Whether it is a vulnerability found by looking at the source code (static) or by attacking the running application (dynamic)technique: The security testing technique with which the vulnerability was detectedwhere: The file path where this vulnerability was foundspecific: The indication of the exact lines of code, inputs (e.g., password fields) or ports where the vulnerability was foundstate: Indicates that the lines of code, inputs or ports are vulnerable (the vulnerability is present)severity: This specific vulnerability's severity score using the CVSScompliance: Whether the vulnerability breaks the build
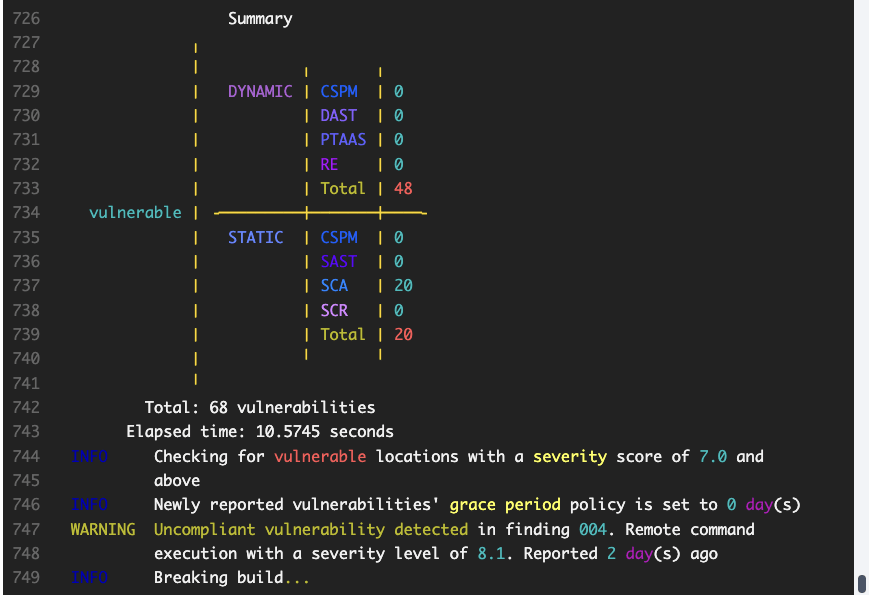
-
Summary: The report concludes with a summary highlighting the total number of unfixed vulnerabilities, the CI Gate execution time, the policies verified, the vulnerability type's name and age, and whether the build was broken or passed.
Search for vulnerabilities in your apps for free with Fluid Attacks' automated security testing! Start your 21-day free trial and discover the benefits of the Essential plan. If you prefer the Advanced plan, which includes the expertise of Fluid Attacks' pentesting team, fill out this contact form.
CI Gate configuration
Generate, update or reset the Fluid Attacks CI Gate token used to fail your pipeline if deploying a build in noncompliance with your policies.
Security gates
The Policies section allows organizations to establish various security gates for vulnerability acceptance and member access control.